What is technical analysis and how do we deal with it?
Technical analysis is the study of price movements or price action in the market over a period of time. Traders use the Price Action method and other trading indicators to analyze the price technically.
Labels: Order to build a Forex robot , Build a stock trading robot , Build a trading robot , Trader robot design , Free Forex Robot , Forex robot programming , Forex Expert Making Tutorial , Build a trading robot with Python , Download Forex Trading Robot , Buy Forex Trader Robot , Automated Forex Robot , Free stock trading robot , Learn how to build a Forex trading robot , Alpari trading robot , Forex robot for Android , MetaTrader robot design , MetaTrader robot programming , Forex robot design , Forex robot programming , Automated trading
However, in my opinion, traders only need the price action method in technical analysis. Not only is Price Action the purest and simplest form of technical analysis in the financial markets, but all indicators and other methods are based on the Price Action method. So it goes without saying that when we analyze the market without any additional indicators, we are actually looking at the clearest market view. Anything else we add to it to help make it clear.
Technical analysis is actually the simplest and most convenient part of trading, and given that it is very common for traders to confuse price charts with other indicators. When you cover the price chart with different indicators, you are actually hiding the only thing you need to analyze, and that is the price information.
Cooperation of Technical Analysis and Price Action
Many professional traders focus on Price Action as a key tool in technical analysis. They do this because they know that price is the most important indicator of market performance.
How many times have you noticed in the market that the price has moved contrary to what you expected after the publication of an economic news? These moves generally have strong signs of price action that have shown themselves before the news broke. Price movements usually lead to news releases and fundamental predictions. That is why so many people use technical analysis and many of them, like us, are pure technicians, meaning that they only use the Price Action method to trade.
There are many reasons why Price Action focuses on economic and fundamental news. Big market players like banks and very large mutual funds that can really shake the market have access to information and tools that petty traders like you and I do not have access to. We can read from their hands what they are doing, and this is done by studying price and price action. We do not need to know who they are or how they do it, we just need to learn to understand the meaning of their movements.
How to use Price Action in technical analysis
Price Action Analysis teaches the trader how to analyze the market structure, find trends and levels of support and resistance, and read the market hand in general. This is a confidential matter that I, as the first person, want to acknowledge, and that is that technical analysis and price action are more art than science. However, Price Action is something you will become more comfortable with over time.
Let’s look at some classic patterns of technical analysis…
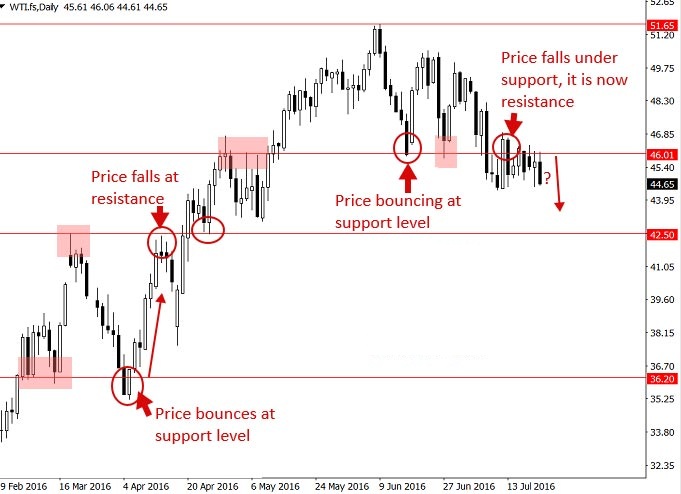
In the chart below you can see how well the price has reacted to the horizontal support and resistance lines. Drawing these lines and trading at these key levels is a very important skill that any technical analyst should learn well. Support and resistance is also a very important aspect of Price Action.

What is technical analysis?
In this chart, we also see that the biggest price movements have taken place in the peaks and valleys of the important market. As you can see, the market has started a strong movement after forming a two-valley pattern, and then after hitting a resistance level in front of it, it has formed a three-peak pattern and has descended. Usually these patterns are good indicators for changing market trends.

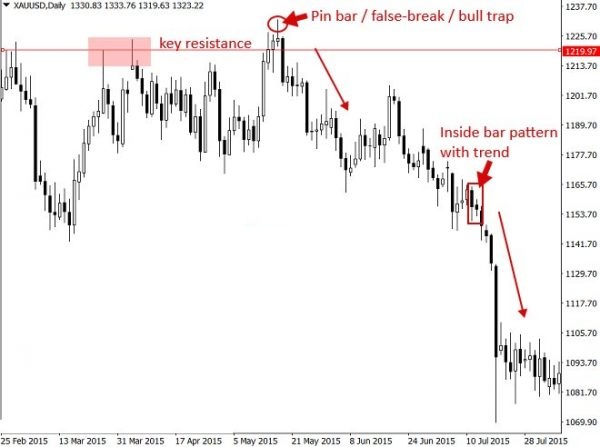
When we look at the price action signals at key levels together, we will have very simple yet very likely entrances to the market, such as an invalid failure at the resistance level of the chart below accompanied by a pin load signal.

What is technical analysis?
If you are new to financial markets, we suggest that you learn technical analysis with Price Action, and if you have experience trading in the market but have not yet reached profitability in your trading, we suggest training Price Action and using Price signals. Action is to practice and make a profit.
Labels: Order to build a Forex robot , Build a stock trading robot , Build a trading robot , Trader robot design , Free Forex Robot , Forex robot programming , Forex Expert Making Tutorial , Build a trading robot with Python , Download Forex Trading Robot , Buy Forex Trader Robot , Automated Forex Robot , Free stock trading robot , Learn how to build a Forex trading robot , Alpari trading robot , Forex robot for Android , MetaTrader robot design , MetaTrader robot programming , Forex robot design , Forex robot programming , Automated trading


