
What is Pivot? | Pivot minor and major training Detect pivot points
This article provides educational explanations of the important points of Pivot in analyzing stock price changes. These points indicate changes in the trend from a full uptrend to a full downtrend or vice versa. The importance of the function of these points is in predicting future prices. Pivot points can also be identified with the help of indicators.
Labels: Order to build a Forex robot , Build a stock trading robot , Build a trading robot , Trader robot design , Free Forex Robot , Forex robot programming , Forex Expert Making Tutorial , Build a trading robot with Python , Download Forex Trading Robot , Buy Forex Trader Robot , Automated Forex Robot , Free stock trading robot , Learn how to build a Forex trading robot , Alpari trading robot , Forex robot for Android , MetaTrader robot design , MetaTrader robot programming , Forex robot design , Forex robot programming , Automated trading
What is Pivot?
Pivots are key points that are evaluated in price charts. Basically, the points that indicate the change in the mutation in the graph are called pivots. It is easy to say that the important points in the charts that determine the direction of price change are the pivots. In this section, we will explain the types of Pivot, the use of pivot, calculation and its computational importance.
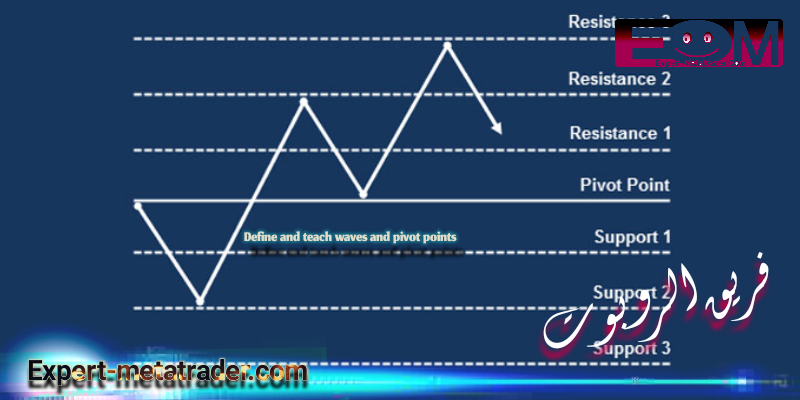
Look at the chart below. If you pay attention, first the price trend chart is going up. Although there is a noticeable decrease at some point in time, the overall chart is rising. The slope of the blue trend line on the left confirms this. But from the point we call Pivot, all of a sudden the price changes, which is indicated by the slope of the red trend line on the right with a downward slope. So Pivot is the tipping point for big trends. Find the point of change in the graph. These are the key points and the main solution of this article
Pivot minor and major training
This section will follow Pivot minor and major training in technical analysis. These points are divided into two types of minor and major points. Pivot minor correction is a major trend followed by oscillators, points with small changes. At these points, the trend changes cross-sectionally and briefly. That is, if it is ascending, it changes direction and decreases in a short period of time, and vice versa. Why are oscillators interested in these points? Because they are looking for a cross-cutting profit. These are the defining points of the days when profits are definitively formed. Oscillation is being done experimentally, but just paying attention to the oscillation flow and taking advantage of momentary opportunities is only for the benefit of the individual, and society and production will not benefit from this movement. But in pivot major, the reversal of the trend is widely formed, and over a longer period of time, the uptrend suddenly declines, and vice versa. These points are very suitable for analysis.
Piot Minor
Note the following figure. Between points A to B, the general trend of the price change chart is upward. It can be seen by drawing a line from A to B that the slope is positive and therefore the trend of change, which is the slope of the line, is ascending. But in the meantime, it is sometimes seen that at times the price changes in limited and small intervals and re-aligns with the general trend, which is upward. These points where the slightest change of direction occurs in a general process are the minor pivots marked with red and blue arrows in the figure below.
Pivot Major
Now look at the chart below. As you can see, before the price reached point B, the general trend of change was positive and we had an upward trend, but when we reached point B, suddenly the trend of change went down. Now, on the other hand, from point B to point C, the general trend of the chart is downward, but when point C is reached, suddenly the overall trend changes. These two points B and C are the same as the major pivot.
Define and teach waves and pivot points
Pivot line indicators
There are indicators based on which pivot lines can be seen on the brokers chart. One of the indicators for drawing pivot lines is the Daily pivot indicator, which teaches how to calculate pivot lines as follows:
To calculate the daily pivot lines, we need the four parameters of yesterday (the interval of the previous day). These four parameters are: highest price, lowest price, candle opening point and yesterday candle closing point.
Pivot Point = High + Low + Close ÷ 3
These lines are similar to the candlestick charts that sequentially show support and resistance points. Using this indicator, daily, weekly and monthly pivots can be identified. Note the following figure. The daily and weekly pivots of this indicator are clear.
Define and teach waves and pivot points
Another indicator that will help us is the Makdi indicator or the MACD indicator, which according to the trend chart below shows the changes and the candlesticks show the price changes in the form of peaks and valleys, minor pivots. And it will show us the major well. Take a look at the chart below. In a clear uptrend, the market correction points have been matched with the Makdi indicator bounce points. The macd indicator has shorter bars than the previous bars.
Define and teach waves and pivot points
How to identify pivot points
In addition to pivot line indicators, to identify pivot points, you can manually draw past market support and resistance points in different timeframes. If these points of support and resistance overlap with the pivot points of the divorce market, the probability of success in our transaction will be doubled.
Importance and application of Pivot
The above figures show how the waves and pivot points are placed next to each other and their identification strategies are also specified. Given the above, it is clear that the importance of Pivot in technical analysis is to identify changing trends. The same pivot function is very valuable in future calculations and predicting price changes at price intervals. Pivot Pivot is a point by which the next peak and valley can be predicted and sell your stock or implement a long-term idea before reaching the descent.
Labels: Order to build a Forex robot , Build a stock trading robot , Build a trading robot , Trader robot design , Free Forex Robot , Forex robot programming , Forex Expert Making Tutorial , Build a trading robot with Python , Download Forex Trading Robot , Buy Forex Trader Robot , Automated Forex Robot , Free stock trading robot , Learn how to build a Forex trading robot , Alpari trading robot , Forex robot for Android , MetaTrader robot design , MetaTrader robot programming , Forex robot design , Forex robot programming , Automated trading


