Closing prices in the last 5 days are as follows:
• Day 1: 1,372
• Day 2: 1,3231
• Day 3: 1,364
• Day 4: 1,3186
• Day 5: 1,3293
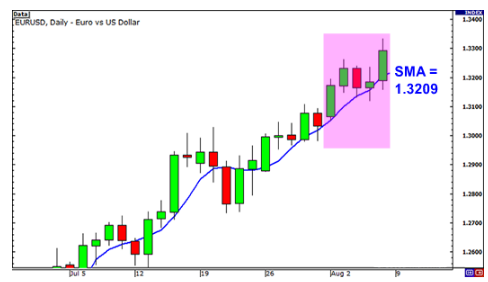
The simple moving average is calculated as follows:
(1.3172 + 1.3231 + 1.3164 + 1.3186 + 1.3293) / 5 = 1.3209
Very simple, right? So what if an important news report is published on Day 2 that causes the euro to fall globally? It causes the EUR / USD to fall and close at the level of 1.3000. Let’s see what effect this will have on the 5SMA course.
- Day 1: 1. 3172
- Day 2: 1.3000
- Day 3: 1. 3164
- Day 4: 1. 3186
- Day 5: 1,3293
The simple moving average is calculated as follows:
(1.3172 + 1.3000 + 1.3164 + 1.3186 + 1.3293) / 5 = 1.3163
The result of a simple moving average will drop a lot, giving you the impression that the price is falling, when in fact the day 2 event happened only once, due to the poor results of an economic report.
The point we are trying to make is that sometimes a simple moving average may be too simple. If there was a way to filter these spikes so that we would not get the wrong idea .. Hmmm کنید Wait a minute له Yes, there is a way!
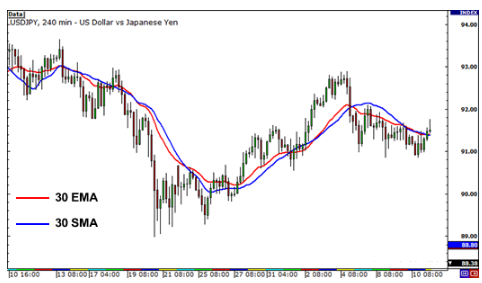
The solution is called the exponential moving average ! The moving average (EMA) gives more weight to recent periods. In our example above, the EMA puts more weight on the recent days, which are days 3, 4 and 5.
This means that Spike will have little value on day 2 and will have no effect on the moving average as much as we calculated in the simple moving average. If you think about it, it makes a lot of sense because the result is more emphasis on what traders are doing lately.