
Candlestick training and candlestick based strategies
Candlestick is one of the most widely used charts in technical analysis, which, like other charts, shows changes in stock prices. Candlesticks were first used by the Japanese and are therefore also called Japanese candlestick charts. By learning the principles of candelabra, analysts can examine the behavior of sellers and buyers of a stock based on the shape of the candelabra. In the image below, we get acquainted with the information contained in each candlestick.
Labels: Order to build a Forex robot , Build a stock trading robot , Build a trading robot , Trader robot design , Free Forex Robot , Forex robot programming , Forex Expert Making Tutorial , Build a trading robot with Python , Download Forex Trading Robot , Buy Forex Trader Robot , Automated Forex Robot , Free stock trading robot , Learn how to build a Forex trading robot , Alpari trading robot , Forex robot for Android , MetaTrader robot design , MetaTrader robot programming , Forex robot design , Forex robot programming , Automated trading
Familiarity with candle stick patterns
The purpose of using candlestick signals or candlestick charts is to make the most of the possibilities. We look for signals to enter or leave the stock by examining the candles.
You can also refer to the section ” Ayzychart ” Trading system Ayzytrydr , candle stick your desired symbol.
The best buying strategy
The best investing strategy is to buy valuable stocks at your lowest level. The highest and lowest price per share can be obtained by drawing the support levels and resistance of each share in its long-term chart. You need more than luck to succeed in affiliate business. To do this, in addition to analyzing the share board using the knowledge of board reading, it is better to examine the candlesticks.
People tend to buy the stock at the price floor and sell it at the price ceiling. This goal can be achieved by looking at candlestick charts, not definitively, but approximately.
Buy signal using candle stick
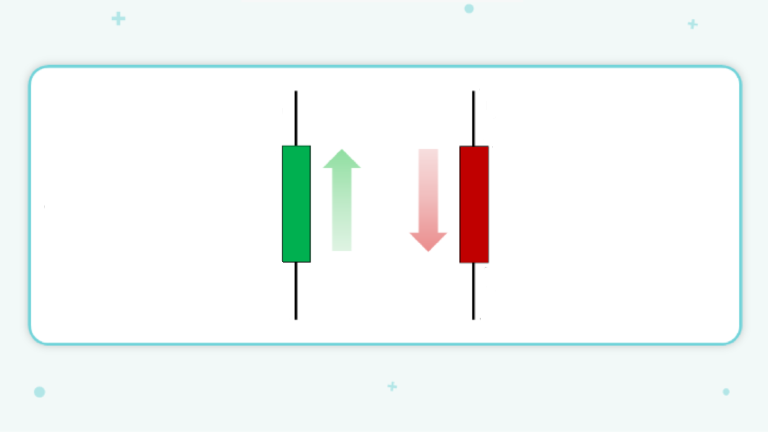
Using the size of the body and the shadow of the candlesticks, analysts examine, analyze and predict the continuation of the stock trend. Candle chart signals indicate a possible change in trend direction. The presence of buyers will be an important factor in determining the severity of this change of direction.
In the daily chart, each candlestick represents the price information of a day from 9:00 to 12:30. When we want to examine the candlestick, we must first pay special attention to the candlestick before it, then to the candlestick formed after it.
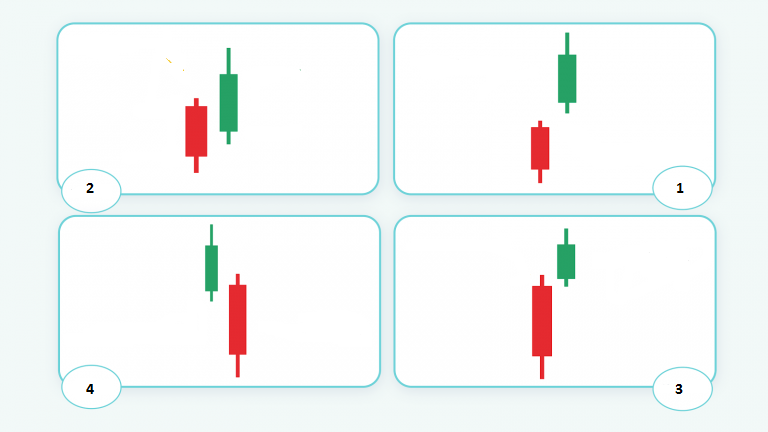
Four scenarios may occur on each day that a candle is lit.
Four scenarios after creating a candlestick
Familiarity with candle stick patterns
Scenario 1
A green, positive candle with an almost large body is formed after a descending red candle. In this case, the lowest price of the green candle is higher than the highest price of the descending candle before it. This indicates that buyers are actively present, and this indicates a valid buy signal.
Scenario II
The general trend of stocks is positive, but the starting price of the bullish candle is lower than the starting price of the previous candlestick. If the buy signal is generated by massive purchases, stock entry may be valid and free of bugs. Try to re-examine the behavior of stocks and shareholders in the first few minutes and through the trading board. If there is no sign of maximum and irrational sales and the rest of the market is in balance, you can enter the stock as a step.
Scenario 3
The green candle created indicates a weak reopening (the small body of the candle indicates a low volume of transactions) but at a higher price than the starting price of the previous day. This scenario is somewhat similar to the first scenario. The difference is that here the trading volume of the uptrend is low and the price fluctuations have caused the shadows of the two candles to overlap. In this case, buyers are still present, but the status of the desired symbol is not good. These types of candles give buyers a warning signal.
Scenario 4
The worst case scenario is that the candlesticks are down and the starting price of the candelabra is lower than the closing price of the previous day. In this case, not many decisions remain. In such a situation, entering the share is wrong.
The best time to check out the candlesticks
Many traders believe that the best time to review candles and make decisions based on them is in the first and last hour of trading time. Because about 60% of daily transactions occur during this time period. Investors’ surveys conducted the day before are used during the first hour of market opening, and this is the best time to use candlestick chart signals.
A general rule of thumb for increasing the profitability of an investment is to stop the investment if the closing price of the stock on the day of its entry (one day after the formation of the buy signal) is less than half of the candle body formed the day before. Pay attention to the defined loss limit, sell the purchased stock with the lowest loss. This candlestick shows that sellers still dominate buyers and neutralizes the reason you bought this stake. But keep waiting for the buy signal to appear and if so, re-enter the trade.
The signals obtained through the candlesticks are not calculated by numerical formula and the purchase price cannot be obtained using the formula. The final decision is entirely up to the analyst and investor.
Use candlestick patterns to buy and sell
Candlestick patterns are closely related to the shape of candlesticks. Analysts can use candlesticks to identify the pattern and thus predict the future trend of the stock.
Patterns such as:
- Harami
- Doji
- Heikin-Ashi
- Engulfing
- Piercing pattern
- Marubozu
- Hammer
- Hanging Man
- Inverted Hammer
- Shooting Star
- Morning Star
- Three ascending stars
- And …
The following is a brief review of the structure of some of these patterns and their implications:
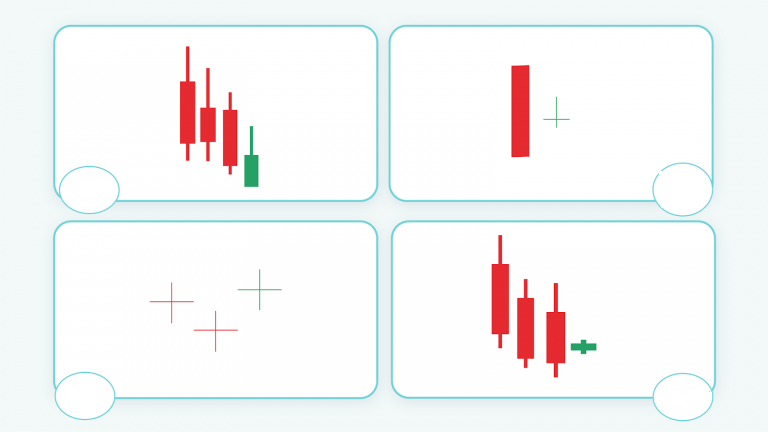
Familiarity with candle stick patterns
- If Doji is seen red after Marobo, it indicates that the share sellers are low and this can be a buy signal.
- If a “hammer” or “reverse hammer” is formed in green in a downtrend, the probability of an uptrend is increased. This means that the share price will increase.
- The Harami pattern consists of two candles next to each other. If the second candle is green at the end of the downtrend, it will be a buy signal. Of course, the most important prediction after seeing this pattern is the slowdown in the price chart.
- The formation of the morning star pattern marks the end of the downtrend and the beginning of the uptrend, and will be a buy signal. The morning star is made up of three candlesticks.
- The three-star rising pattern also consists of three candles. If there is a descending gap between the first and second candles and an ascending gap between the second and third candles, we will probably see a trend change from descending to ascending.
Familiarity with candle stick patterns
- The bullish engulfing pattern has a high effect. Seeing this candle in the candle chart shows that buyers are entering the stock with power. Even for some analysts, the emergence of this candle alone is a sign of rising prices and a buy signal. This pattern consists of a candle at the end of the process that has a large body, so that it covers several candles before it.
What is better to review
The ability to examine how a stock opens before the market reopens can significantly improve the investor’s position and, in addition to being more profitable, prevent risky trades. Entering a trade involves a set of analyzes. Just as your decision about what to wear today involves a number of considerations, such as weather, temperature, and بررسی reviews, you should also consider several factors to consider when entering each share. In this article, we tried to go into more detail about candlesticks or candle charts and talk about safer price points to enter according to the shape of the candlesticks.
Labels: Order to build a Forex robot , Build a stock trading robot , Build a trading robot , Trader robot design , Free Forex Robot , Forex robot programming , Forex Expert Making Tutorial , Build a trading robot with Python , Download Forex Trading Robot , Buy Forex Trader Robot , Automated Forex Robot , Free stock trading robot , Learn how to build a Forex trading robot , Alpari trading robot , Forex robot for Android , MetaTrader robot design , MetaTrader robot programming , Forex robot design , Forex robot programming , Automated trading


