
Fibonacci tools and their application in technical analysis
Fibonacci instruments in financial markets are a way to analyze the return or continuation of a trend. In other words, Fibonacci tools are points of support and resistance that are drawn with various tools and methods. Percentages are extremely important in the use of these tools. It is important to know that Fibonacci includes a wide range of tools, some of the most important of which are covered in technical analysis training.
Labels: Order to build a Forex robot , Build a stock trading robot , Build a trading robot , Trader robot design , Free Forex Robot , Forex robot programming , Forex Expert Making Tutorial , Build a trading robot with Python , Download Forex Trading Robot , Buy Forex Trader Robot , Automated Forex Robot , Free stock trading robot , Learn how to build a Forex trading robot , Alpari trading robot , Forex robot for Android , MetaTrader robot design , MetaTrader robot programming , Forex robot design , Forex robot programming , Automated trading
Fibonacci tools
- Fibonacci Correction Fibonacci Retracement (RET)
- Fibonacci External Fibonacci Extension (EXT)
- Fibonacci Expansion (EXP)
- Fibonacci Projection (PRO)
- Fibonacci arcs
- Fibonacci Wind Fan
- Fibonacci Channel
Fibonacci Retracement
It can be said that one of the most important Fibonacci tools is the Fibonacci corrective tool. Using Fibonacci correction, we can estimate the possible percentages for the end of a correctional move and get the right entry points. Before we talk about this tool, you need to know about Fibonacci percentages. Key levels in this tool include five levels “23.6%”, “38.2%”, “50%”, “61.8%”, “78.6%”.
The percentages mentioned are the most important Fibonacci percentages, but of these, 61.8, known as the golden percentage, is more important, and most correction moves are completed at 61.8.
Also note that the 50% ratio is not a Fibonacci prime number, but traders believe that the price reacts well to the 50% level, which is why the number 50 is included in this tool.
First we want to explain Ribbon Fibonacci. When the market is moving in a certain direction, at times it tends to correct a price in which it never goes beyond the floor and ceiling that we have drawn for Fibonacci.
How to draw this tool
1. We must first identify a specific trend. This trend can be ascending or descending.
2- The point that we should pay attention to is that the diagnosis of using the tool is completely personal and undoubtedly experience can be the first important component in using it and for recognizing the points of the floor and ceiling, experience shows itself significantly.
3- To draw, we must connect the floor to the ceiling in the ascending process after selecting the tool, and the ceiling to the floor in the descending process.
4- For the way of trading, we have to wait for the reaction of traders at one of the Fibonacci levels. Explanation To determine if this is a level of support or resistance, you need to consider all the parameters that you normally considered for a support or resistance. Among these, the ratios of 61.8% and 38.2% are more important in return. First you have to be sensitive to the level of 38.2%, and if you pass this level, you will be sensitive to 61.8%, and if you cross this level, the next level will be 78.6%, and if it breaks, probably with the floor. A price hits and most likely breaks this floor.
With these interpretations, if it is an uptrend, we can use this tool to examine its support, which is clearly illustrated in the following examples. After selecting, we connect point one to two to get the levels.
Do not forget that these two points are a minimum and a maximum.
The following charts have been used to gain support within the trend, we can also get resistance to gain within an uptrend. Note that the correction mode is related to the inside of a floor and ceiling.
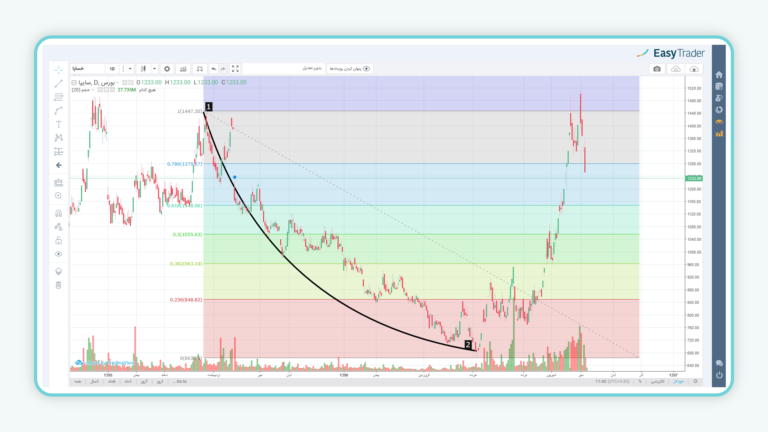
Fibonacci definition of retribution; Definitions and levels
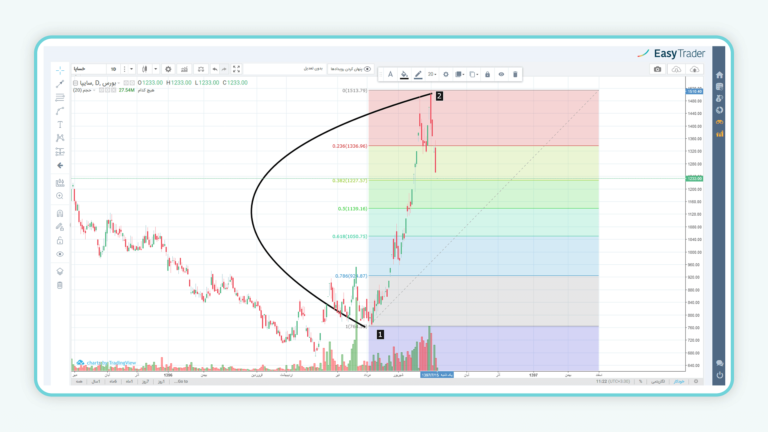
Fibonacci definition of retribution; Definitions and levels
Fibonacci Extension
External Fibonacci (EXT) is one of the Fibonacci tools that is used to predict price levels above 100%, so that if a stock crosses its previous ceiling, so that we can identify new resistance levels of the stock after crossing the previous ceiling. We can use this tool.
How to draw this tool
To draw an external Fibonacci, it is enough to attach the point of the previous maximum ceiling to the floor exactly the opposite of the corrective state. As you can see in the figure below, for the following contribution we were able to identify new resistance points. The same is true for the opposite case, in which case the stock crosses its previous floor, and this time by connecting the minimum point to our previous maximum, we can identify new levels of the stock. It should be noted that this tool is also introduced with Fibonacci Expansion (EXP) modification.
In this case, we connect point one to two to obtain external points; Therefore, this model has been used for an external state and to obtain resistance points, which we can use both in the ascending and descending trends.
Note that the external Fibonacci is a floor and ceiling for the outside; Consider the following examples.
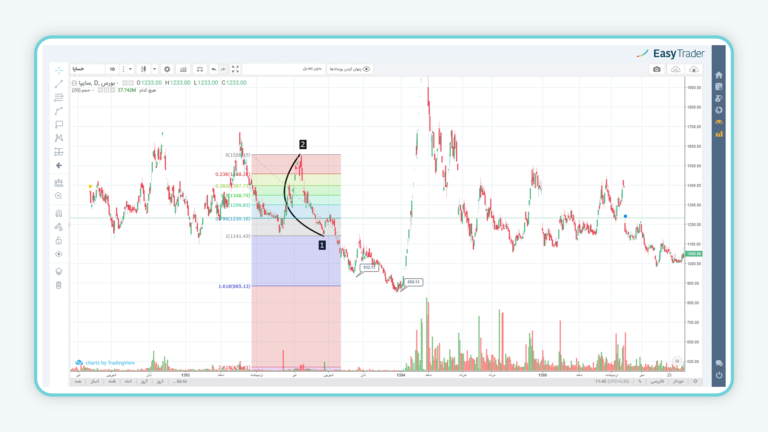
Fibonacci definition of retribution; Definitions and levels
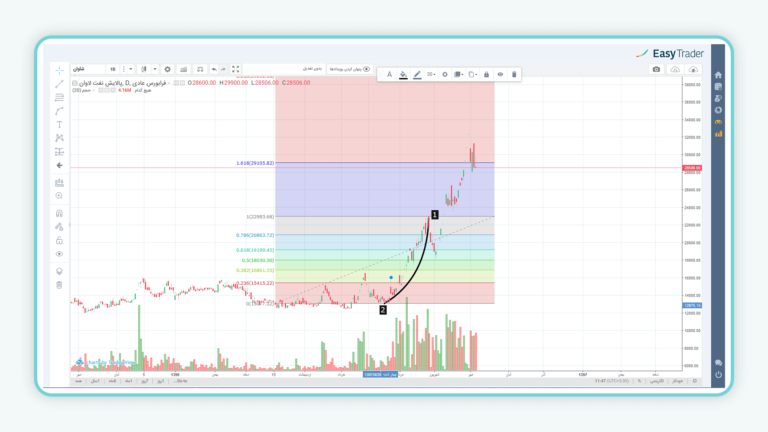
Fibonacci definition of retribution; Definitions and levels
Fibonacci Projection
The name of this tool is incorrectly given in Exp in MetaTrader, while Pro should have been named, but in Dynamic Trader it is called as Apps.
Labels: Order to build a Forex robot , Build a stock trading robot , Build a trading robot , Trader robot design , Free Forex Robot , Forex robot programming , Forex Expert Making Tutorial , Build a trading robot with Python , Download Forex Trading Robot , Buy Forex Trader Robot , Automated Forex Robot , Free stock trading robot , Learn how to build a Forex trading robot , Alpari trading robot , Forex robot for Android , MetaTrader robot design , MetaTrader robot programming , Forex robot design , Forex robot programming , Automated trading
How to draw this tool
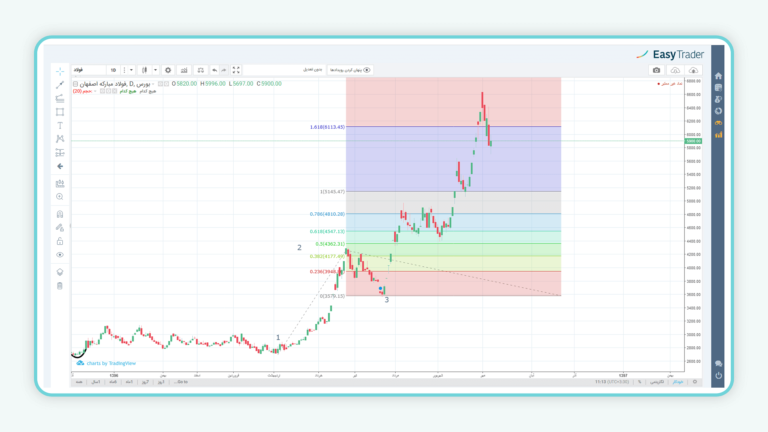
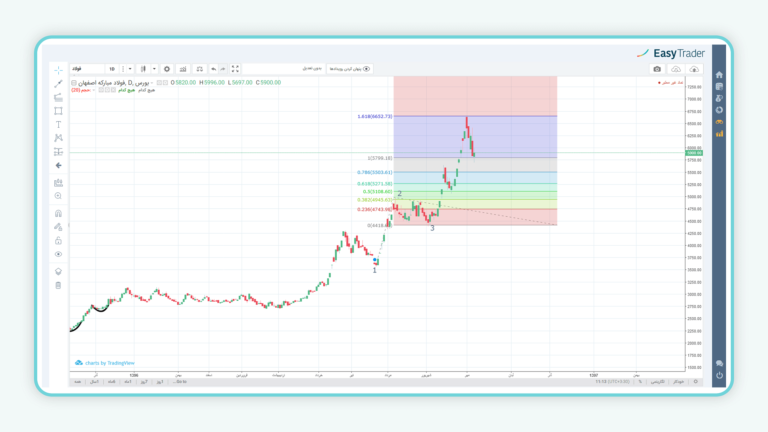
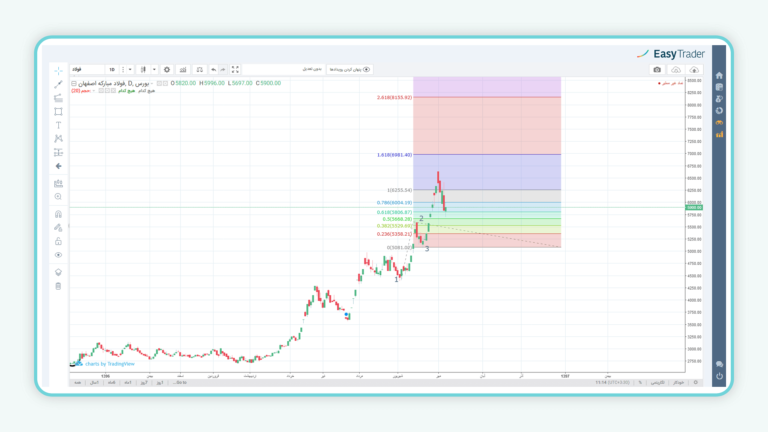
To use Fibonacci projection, three points must be used, which include the point of the floor, the ceiling, and a correction, both in the ascent and in the descent, which must be diagrammatically checked; That is, first the floor or ceiling, then the roof or floor, and finally by dragging the tool to the point of correction, it obtains points outside the range for us.
According to the following figures, as you can see, these tools are more often repeated in ascending or descending trends, which are called rallies and have more validity.
According to the following pattern, when we cross the axis of the horizontal line and line A, we can use three points to predict the price and draw the tool as follows. First we draw the first point of the tool on one, then the second point on two, and finally up to point three to get the resistance points in the future.
Fibonacci definition of retribution; Definitions and levels
Fibonacci definition of retribution; Definitions and levels
Fibonacci definition of retribution; Definitions and levels
Fibonacci arcs
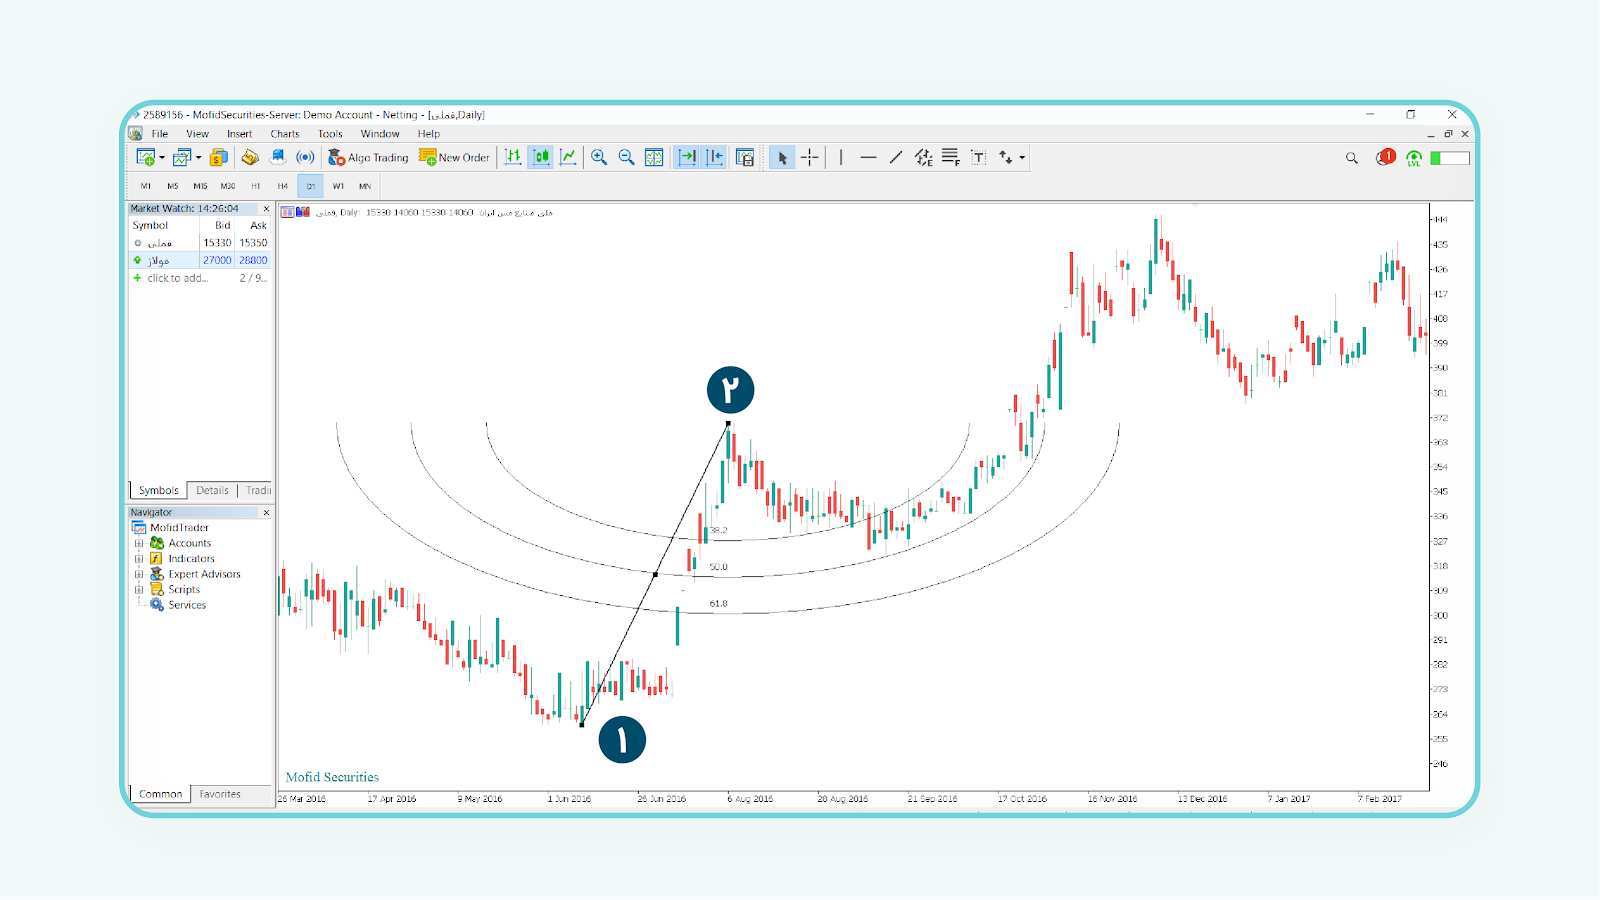
The Fibonacci tool for bows, known as Arcs, displays correction levels in the form of arcs. In other words, bows determine price reversals based on an uptrend or a downtrend.
How to draw this tool
To draw this tool, we need two points at the beginning and end of the process. All you have to do is connect the two points using the Fibonacci Arcs tool. This tool displays the return levels of a trend in parallel arcs. In other words, it can be said that bows determine price reversals based on the uptrend or downtrend.
Fibonacci definition of retribution; Definitions and levels
Fibonacci Wind Fan
The Fibonacci fan tool, known as the Fan, displays correction levels in the form of trend lines.
How to draw this tool
Simply select the Fibonacci Fan and connect the candlesticks at the beginning and end of the process. The other lines that this tool displays have a lower slope compared to the main trend. These lines can be used as price return balances.

Fibonacci definition of retribution; Definitions and levels
Fibonacci tools: Fibonacci Channel
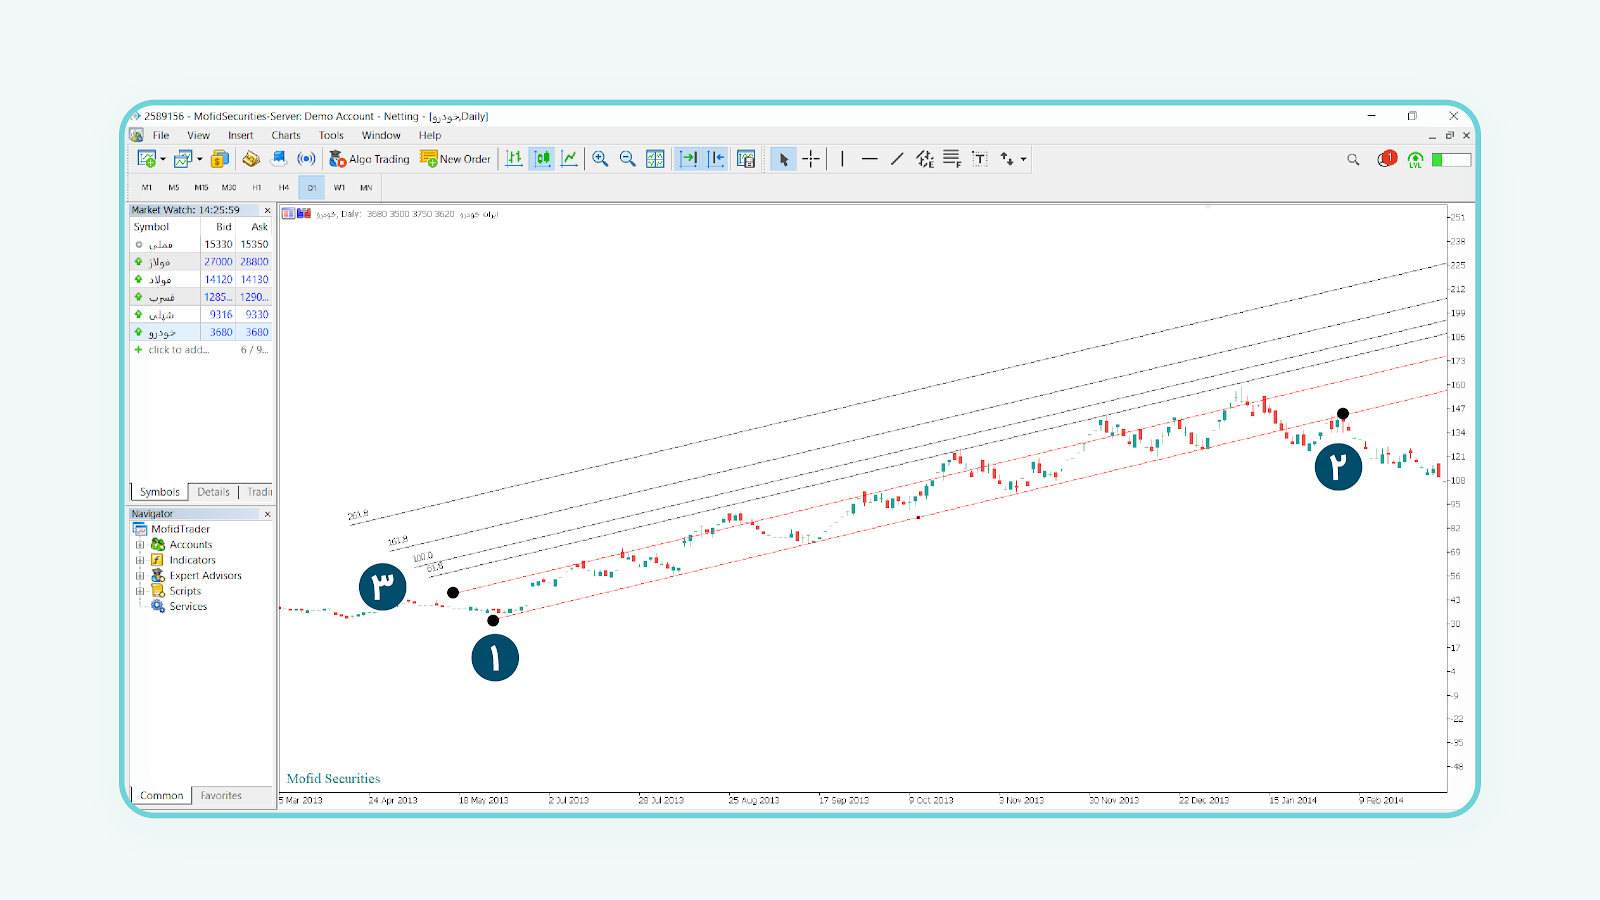
This tool is used to analyze price charts that are moving within a channel . When a channel breaks, one can easily determine the support and resistance points of the price chart based on the Channel toolbars.
How to draw this tool
To draw this tool, just select “channel”. Then determine the floor and ceiling of the canal using the three points provided by this tool.
Fibonacci definition of retribution; Definitions and levels
Note that the more channel lines collide with the price chart, the more valid that channel is and the more accurate the return lines drawn by the Fibonacci tool.
Labels: Order to build a Forex robot , Build a stock trading robot , Build a trading robot , Trader robot design , Free Forex Robot , Forex robot programming , Forex Expert Making Tutorial , Build a trading robot with Python , Download Forex Trading Robot , Buy Forex Trader Robot , Automated Forex Robot , Free stock trading robot , Learn how to build a Forex trading robot , Alpari trading robot , Forex robot for Android , MetaTrader robot design , MetaTrader robot programming , Forex robot design , Forex robot programming , Automated trading


