What is a moving average ribbon?
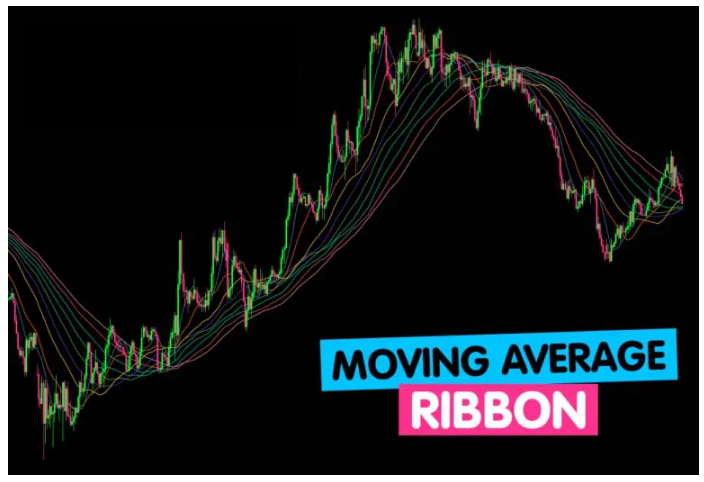
Moving Average Ribbons are a set of moving averages with different time intervals that are plotted on a chart.
The main idea behind the Moving Average Ribbon is that instead of using one or two moving averages on the chart , use a moving average category (usually between 6 and 16 moving averages or more). Collectively on a chart.
Labels: Order to build a Forex robot , Build a stock trading robot , Build a trading robot , Trader robot design , Free Forex Robot , Forex robot programming , Forex Expert Making Tutorial , Build a trading robot with Python , Download Forex Trading Robot , Buy Forex Trader Robot , Automated Forex Robot , Free stock trading robot , Learn how to build a Forex trading robot , Alpari trading robot , Forex robot for Android , MetaTrader robot design , MetaTrader robot programming , Forex robot design , Forex robot programming , Automated trading
Let’s look at an example:

How to analyze trends with moving average ribbons?
Moving Average Ribbons are a group of moving averages that are placed on a chart.
Traders can determine the strength of a trend by looking at the smoothness of the ribbon , as well as identify key areas of support or resistance by looking at the price of the ribbon .
Settings of a moving average ribbon
A common question is: “How many moving averages should I use?”
It really depends on the trader.
Some traders like to use six to eight simple moving averages (SMAs) by adjusting them to 10-day intervals, such as 10, 20, 30, 40, 50 and 60-day SMAs.
Some other traders like to use 16 moving averages (or more) variable from a simple moving average of 50 to 200 days and all the intervals between the two numbers.
The reason for using longer moving averages is to take a closer look at the overall trend.
Some traders also like to use the exponential moving average instead of the simple moving average.
So the choice is really a matter of taste.
The response rate of the moving average ribbon can be adjusted using the following:
• Change the number of time periods used in the moving average;
• Change the moving average type from simple moving average ( SMA ) to exponential moving average ( EMA ).
The fewer periods used when selecting and adding moving averages on the chart, the more sensitive the moving average ribbon is to minor price changes.
The moving average ribbon with more time periods (such as 200 days) is less sensitive and smoother.
How to deal with moving average ribbons
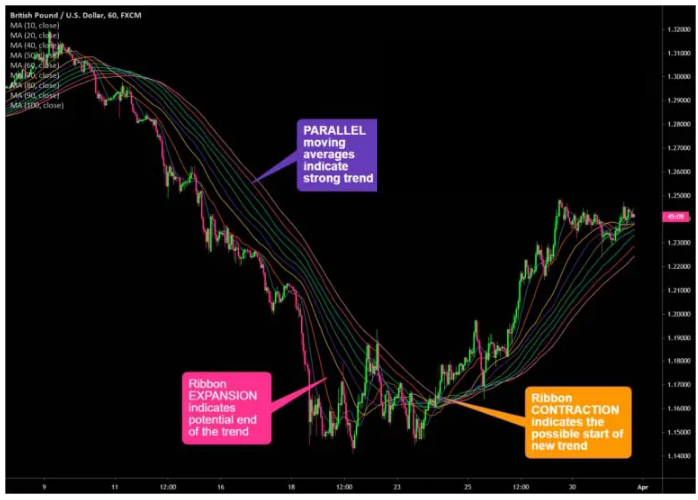
1. An expanding moving average ribbon indicates the probable end of the trend.
When moving averages begin to open and separate, it is also called a moving average ribbon. This indicates that the price direction has reached its peak and can be the end of a trend.
Think of moving averages as a magnet that attracts each other .
They do not like to be apart for too long. So when they are in such a state, they tend to close this gap.
2. A moving average ribbon indicates a possible trend reversal .
As the moving averages begin to approach, also known as the moving average contraction or contraction of the ribbon, the trend probably begins to change.
After a sharp price movement in one direction, you know Moving Average Kvtahmdttr first close together earlier. Moving Average longer slowly closer together.
Labels: Order to build a Forex robot , Build a stock trading robot , Build a trading robot , Trader robot design , Free Forex Robot , Forex robot programming , Forex Expert Making Tutorial , Build a trading robot with Python , Download Forex Trading Robot , Buy Forex Trader Robot , Automated Forex Robot , Free stock trading robot , Learn how to build a Forex trading robot , Alpari trading robot , Forex robot for Android , MetaTrader robot design , MetaTrader robot programming , Forex robot design , Forex robot programming , Automated trading
3- Parallel moving average ribbon indicates a strong trend.
When the moving average ribbons are placed in parallel and evenly spaced, it means that the current trend is strong .
All moving averages agree because they move together.
Watch the distances between moving averages.
Some traders make mistakes and only pay attention when moving averages ” break ” or ” rotate “.
While it is important to always monitor when short-term moving averages cross long-term (or low) moving averages, it is equally important to monitor the distance between moving averages.
Shows the location and position of short-term moving averages relative to long-term moving averages in the direction of the trend ( descending, neutral, ascending ).
The distance between moving averages indicates the strength of the trend ( weak, neutral, strong ).
Example for moving average ribbon
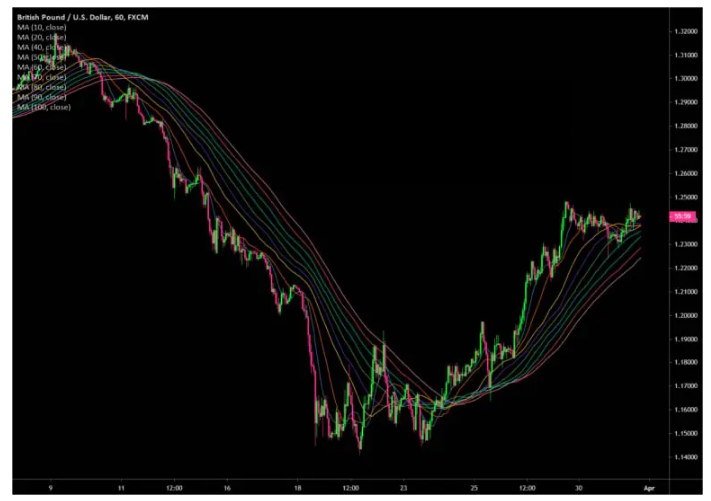
Let’s take a look at the moving average ribbon applied to the 1-hour GBP / USD chart.

How to analyze trends with moving average ribbons?
Example of a moving average ribbon of the GBP / USD currency pair
Can you see the trend changes ?

How to analyze trends with moving average ribbons?
In the chart above, you can easily tell the uptrend or downtrend by looking at when moving averages begin to cross each other and change direction up or down.
The opening of the ribbon or the widening of the distance between the moving averages marks the end of the current trend.
Shrinking the ribbon or reducing the distance between moving averages indicates the beginning of a new trend.
Labels: Order to build a Forex robot , Build a stock trading robot , Build a trading robot , Trader robot design , Free Forex Robot , Forex robot programming , Forex Expert Making Tutorial , Build a trading robot with Python , Download Forex Trading Robot , Buy Forex Trader Robot , Automated Forex Robot , Free stock trading robot , Learn how to build a Forex trading robot , Alpari trading robot , Forex robot for Android , MetaTrader robot design , MetaTrader robot programming , Forex robot design , Forex robot programming , Automated trading


