

How to draw the trend line correctly?
You may also be wondering how to draw a trend line ? Different analysts have different views on how to draw the trend line . But the most common way to draw a trend line is to draw on charts with a Japanese candle pattern.
Labels: Order to build a Forex robot , Build a stock trading robot , Build a trading robot , Trader robot design , Free Forex Robot , Forex robot programming , Forex Expert Making Tutorial , Build a trading robot with Python , Download Forex Trading Robot , Buy Forex Trader Robot , Automated Forex Robot , Free stock trading robot , Learn how to build a Forex trading robot , Alpari trading robot , Forex robot for Android , MetaTrader robot design , MetaTrader robot programming , Forex robot design , Forex robot programming , Automated trading
Use the upper price point to draw the downtrend line and the lower price point to draw the uptrend line. For a trend line to be valid, you must have at least 3 top or bottom points.
The more up or down points on a chart that the trend line crosses, the more credible the trend line will be; Because, more analysts will use that line to identify support and resistance points.
Also, you can draw the trend line with at least two price ceilings or two price ceilings formed in the sample.
How to draw trend lines
Important points regarding chart time periods:
Trend lines drawn over a higher period of time are more powerful. Therefore, it is better to use long-term charts. For example, start your analysis with a weekly chart and gradually reduce the time periods.
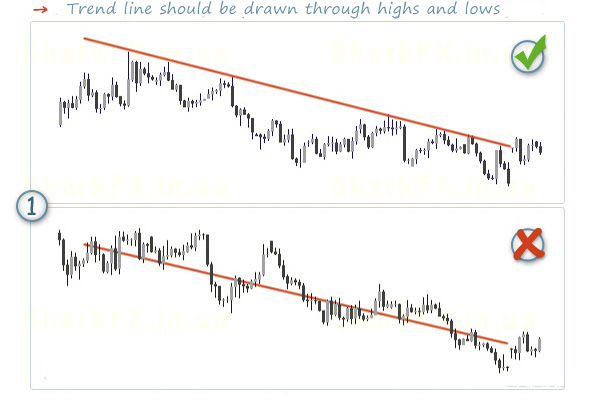
Try to find the trend line that has the most collisions and does not pass through the body of the precious candles during these collisions. The process line that passes through the body of the candles has no validity or value.
Many analysts prefer the daily chart to other time periods and consider the best time period to identify market trends; Because its temporal nature is not purely short-term or long-term. By reviewing the daily trend, you will be able to analyze a reasonable period with its important details.
Another thing you need to know about how to draw a trend line is that the longer the time between two points or starting points, the more important the trend line is.
One of the most important questions that may come to your mind when learning how to draw a trend line is which area of the candlesticks should we consider the trend line based on? The answer to this question depends on your point of view and the conditions of the chart.
In fact, it is very rare for a trend line to fully match the highs or lows or the opening and closing of price candles. It can be said that there is no specific rule in this regard. Each analyst can use different time periods based on personal experience and perspective. When drawing the trend line, it is enough to focus on not crossing the body of the candle and the line.
An important point about how to draw a trend line :
To draw a trend line in ascending waves, you need to connect the pits to each other. The hole is where the price returns and from that point, the price has not come lower.
On the other hand, in descending waves, you have to consider the peaks. The peak is another price point where prices have not been able to rise.
Pits and peaks are generally called pivots. In mathematics, Pivot is the extreme.
How to use trend lines in our transactions?
When trading based on this technical tool, there are two main methods that are as follows:
1. It is when prices have gone through a certain trend and have a role of absolute support or resistance. In such cases, depending on the current market trend, you can enter the buying position when prices are on the support lines.
Also, when prices touch a resistance line, it is a position to exit the market or a position to sell.
2. Occurs when the price candle is broken and the price higher or lower than that candle is closed. In such a case, the trend line is reversed.
For example, the danger of the downtrend that we considered as resistance is now broken and becomes a line of support. Most traders wait for prices to return to the trend line and at that point, make a low-risk trade.
Closing remarks:
Our recommendation is for analysts to use the multi-time analysis technique to increase the credibility of the analysis and reduce the risk of trading; For example, if you want to trade according to the uptrend line in the weekly time period, it is better to follow the overlapping trend lines in the daily chart.
Under no circumstances should you draw lines and force the regulation out of false prejudices and misconceptions; This is because these biases affect how the trend line is drawn and lead to misdiagnosis of support and resistance levels.
So, if the trend line does not fully conform to the rules of graph analysis, go for other tools or patterns.
Labels: Order to build a Forex robot , Build a stock trading robot , Build a trading robot , Trader robot design , Free Forex Robot , Forex robot programming , Forex Expert Making Tutorial , Build a trading robot with Python , Download Forex Trading Robot , Buy Forex Trader Robot , Automated Forex Robot , Free stock trading robot , Learn how to build a Forex trading robot , Alpari trading robot , Forex robot for Android , MetaTrader robot design , MetaTrader robot programming , Forex robot design , Forex robot programming , Automated trading


