
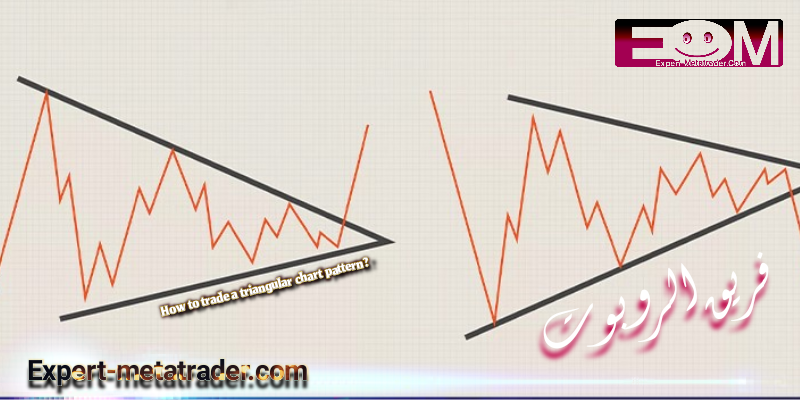
In the triangle pattern, the price moves in a narrower and narrower range over time, providing a picture of a battle between cows and bears.
The triangle pattern is generally categorized as a “continuation pattern”, meaning that once the pattern is complete, it is assumed that the price will continue to move in the same direction as before the pattern appears.
A triangular pattern usually solidifies and forms when it includes at least five touches and tests on supports and resistances.
Labels: Order to build a Forex robot , Build a stock trading robot , Build a trading robot , Trader robot design , Free Forex Robot , Forex robot programming , Forex Expert Making Tutorial , Build a trading robot with Python , Download Forex Trading Robot , Buy Forex Trader Robot , Automated Forex Robot , Free stock trading robot , Learn how to build a Forex trading robot , Alpari trading robot , Forex robot for Android , MetaTrader robot design , MetaTrader robot programming , Forex robot design , Forex robot programming , Automated trading
For example, touch the support line three times and touch the resistance line twice. Or vice versa.
Just like shengol, mongol, and grapefruit, there are three types of graph arrangement for triangles: symmetrical triangle, ascending triangle, and descending triangle.
Symmetrical triangle pattern
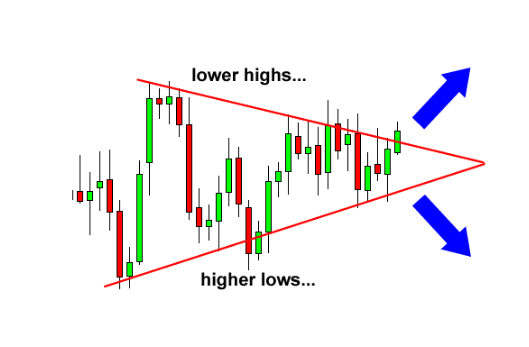
A symmetrical triangle is a structure or graphical arrangement in which the slope of the price ceilings and the slope of the price ceilings converge and reach a point where the structure resembles a triangle.
What happens during this structure and arrangement is that the market is building lower ceilings and higher floors.
This means that neither buyers nor sellers push the price hard enough to create a certain trend.
If we consider it a battle between buyers and sellers, the result will be a draw.
In other words, it is a kind of price stabilization.
How to trade a triangular chart pattern?
An example of how a symmetric triangle works
In the chart above we see that neither buyers nor sellers can push the price towards them. When this happens, lower ceilings and higher floors are formed.
The more the two slopes converge, the closer the failure is to one side.
We do not know in which direction the failure will be, but we know that the market will most likely fail on one side. Eventually, one side of the market will give up.
So how can we take advantage of such a structure?
it’s simple.
We can place our incoming orders above the slope of the lower ceilings and below the slope of the higher floors of the symmetrical triangle.
Since we know the price intends to break in one direction, we can ride in any direction the market moves.
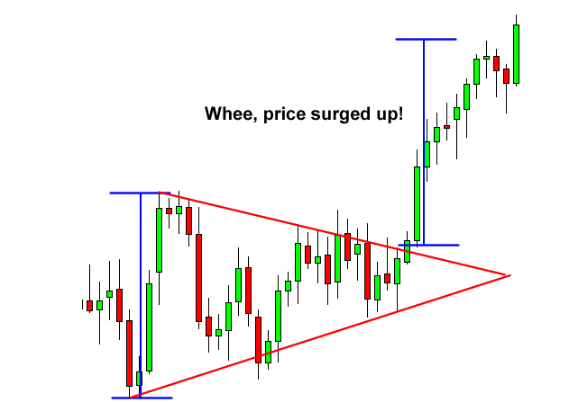
How to trade a triangular chart pattern?
In this example, if we placed an entry order on top of the lower roof slope, we would get a nice ride up.
If you placed another entry order below the higher floor slope, you would cancel it as soon as the first order was activated.
Ascending triangle pattern
An ascending triangle is a graphic pattern of a triangle that occurs if there is a resistance level and a higher floor slope.
What happens during this time is that there is a certain level that buyers do not seem to go beyond. However, they are gradually starting to rise in price, as evidenced by the existence of higher floors.
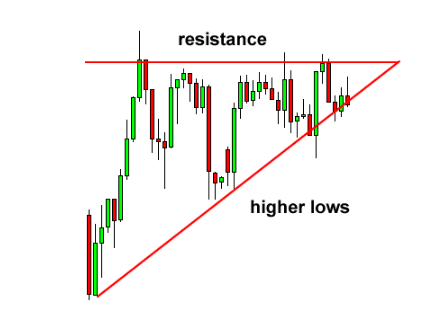
How to trade a triangular chart pattern?
In the chart above, you can see that the power of buyers is slowly increasing as they build higher floors.
They constantly push that level of resistance, and as a result, failure to one side is inevitable.
To break the price in the ascending triangle
Now the question is, “Which way is the price going?” Can buyers break that level or will the resistance be stronger than that? ”
Many chart books tell you that in most cases, buyers win the battle and the price crosses the barrier of resistance.
However, our experience has been that this is not always the case.
Sometimes the resistance level is very strong and there is not enough purchasing power to cross it.
In most cases, according to experience, the price actually goes up. The point we are trying to make is that you should not be obsessed and worry about where the price is going, but you should be prepared to take a position in any direction .
In this example, we place an entry order above the resistance line and below the slope of the higher floors.
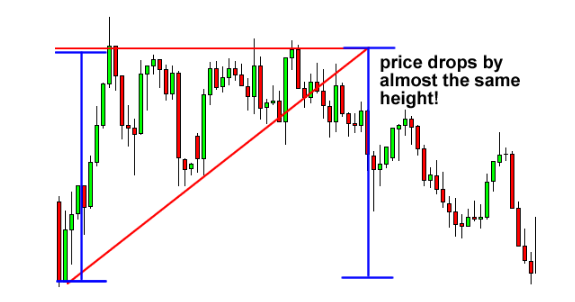
How to trade a triangular chart pattern?
In this scenario, the buyers lost the battle and the price dropped! You can see that the price drop was about the same as the height of the triangle structure.
If we put our sales order under the bottom of the triangle, we could take advantage of this price drop and make good pips.
Descending triangle pattern
As you may have guessed, the descending triangle is exactly the opposite of the ascending triangle (we knew you were smart!)
In descending triangle diagrams, there are strings of ceilings or lower peaks that form the upper line. The bottom line is the support level at which the price does not seem to break.
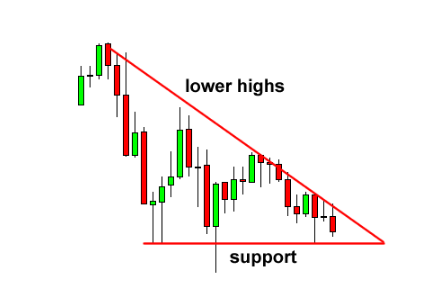
How to trade a triangular chart pattern?
In the chart above, you can see that the price is gradually building lower peaks, which tells us that sellers are advancing and gaining ground in a battle with buyers.
Most of the time, and we emphasize most of the time, the price eventually breaks the support line and continues to fall.
However, in some cases, the support line will be very strong and the price will react to it and take a strong uptrend.
The good news is that we do not care where the price goes. Only we know that the price is going to go somewhere.
In this case, we place incoming orders above the top line (lower ceilings) and below the support line.
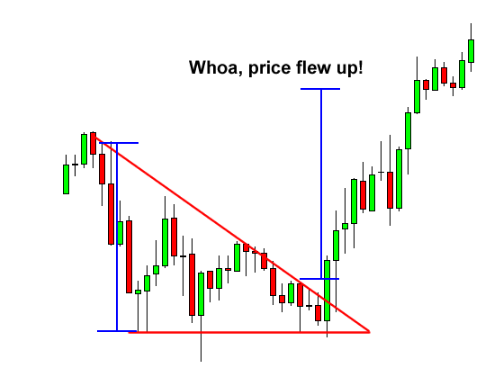
How to trade a triangular chart pattern?
In this case, the price eventually breaks from the top of the triangular pattern ceiling.
After an uptrend, the price goes up by almost the same amount as the height of the triangle.
It would be a good idea to place an entry order on top of the triangular roof and aim at the height of the structure.
Labels: Order to build a Forex robot , Build a stock trading robot , Build a trading robot , Trader robot design , Free Forex Robot , Forex robot programming , Forex Expert Making Tutorial , Build a trading robot with Python , Download Forex Trading Robot , Buy Forex Trader Robot , Automated Forex Robot , Free stock trading robot , Learn how to build a Forex trading robot , Alpari trading robot , Forex robot for Android , MetaTrader robot design , MetaTrader robot programming , Forex robot design , Forex robot programming , Automated trading


