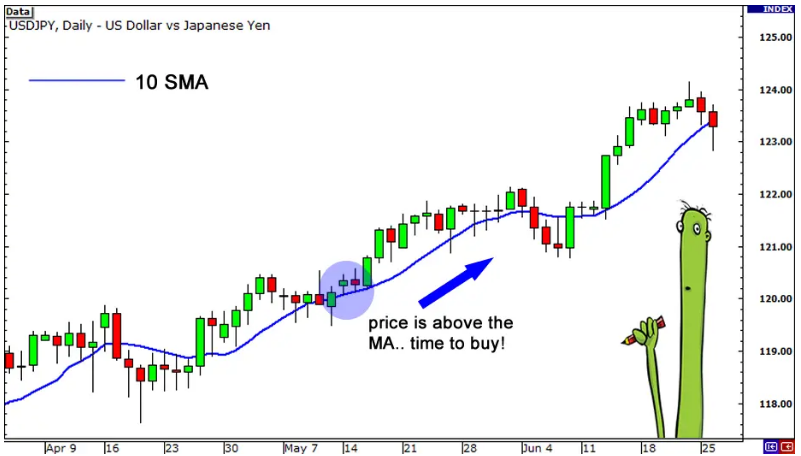
One of the sweetest ways is to use a moving average to determine the trend. How to do this is very simple. Just draw a moving average on the chart.
When price movements tend to stay above the moving average, it indicates that the price is generally on an uptrend .
Labels: Order to build a Forex robot , Build a stock trading robot , Build a trading robot , Trader robot design , Free Forex Robot , Forex robot programming , Forex Expert Making Tutorial , Build a trading robot with Python , Download Forex Trading Robot , Buy Forex Trader Robot , Automated Forex Robot , Free stock trading robot , Learn how to build a Forex trading robot , Alpari trading robot , Forex robot for Android , MetaTrader robot design , MetaTrader robot programming , Forex robot design , Forex robot programming , Automated trading
If the price movement tends to stay below the moving average, it indicates a downward trend .

How to use the moving average to detect trends
The only problem is that this method seems a little too simplistic.
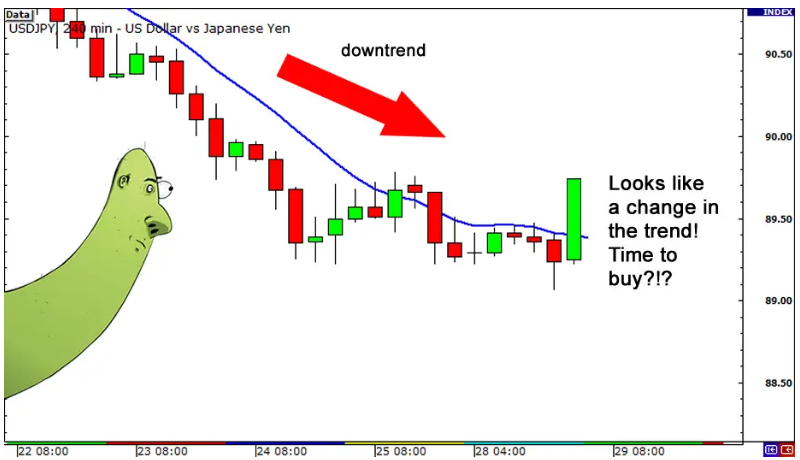
Suppose the USD / JPY has a downtrend, but a news release is released causing it to rise.

How to use the moving average to detect trends
You can see that the price is now higher than the moving average. You say to yourself:
“It seems that this currency pair is on the verge of changing direction. It’s time to buy this ! “
In short, you do. You buy one billion units because you are confident that the USD / JPY will rise.

How to use the moving average to detect trends
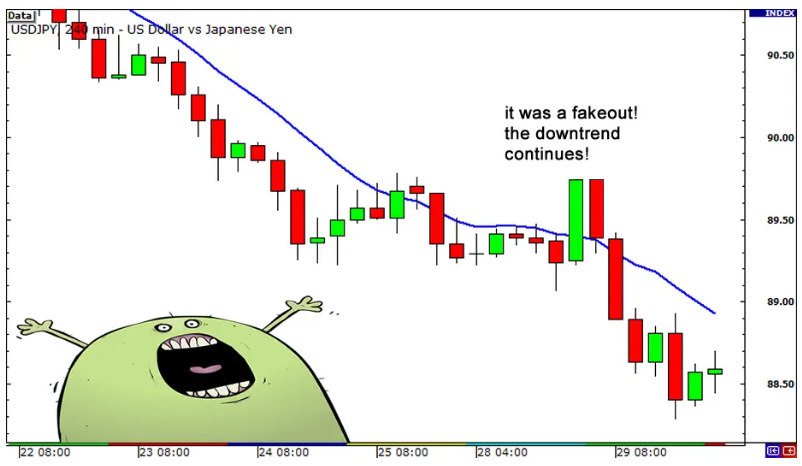
دیشششش! The signal was fake and could mislead you!
It turns out that traders reacted to this news, but the trend continued and the price came down!
How to filter a false moving average signal?
What some traders do, and we suggest you do the same, is to draw two or three moving averages together in their charts instead of just a moving average .
This gives them a clearer signal whether the pair is trending up or down. Which is determined by the order of moving averages.
Let us explain.
In an uptrend, the “faster” moving average should be higher than the “slower” moving average, and vice versa in the downtrend. We know that the shorter the period of a Moving Origin, the faster it is, and the longer the period, the slower it is.
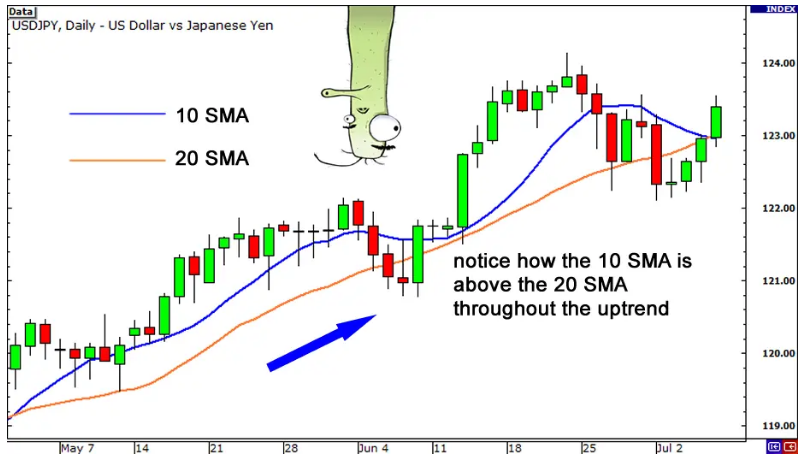
For example, suppose we have two MAs: a moving average of 10 periods and a moving average of 20 periods. On the chart, it will look like this:

How to use the moving average to detect trends
Above is the daily USD / JPY chart.
Across the uptrend, 10 SMA is higher than 20 SMA.
As you can see, you can use a moving average pair to tell if a pair is moving up or down.
By combining this with your knowledge of trend lines, you can decide whether to buy or sell a currency pair.
You can also place more than two moving averages on your chart.
Just as long as the lines are in order (MA faster on MA slower on an uptrend, MA slower on MA faster on a downtrend), you can tell if the pair is on an uptrend or on a downtrend.
Labels: Order to build a Forex robot , Build a stock trading robot , Build a trading robot , Trader robot design , Free Forex Robot , Forex robot programming , Forex Expert Making Tutorial , Build a trading robot with Python , Download Forex Trading Robot , Buy Forex Trader Robot , Automated Forex Robot , Free stock trading robot , Learn how to build a Forex trading robot , Alpari trading robot , Forex robot for Android , MetaTrader robot design , MetaTrader robot programming , Forex robot design , Forex robot programming , Automated trading


