

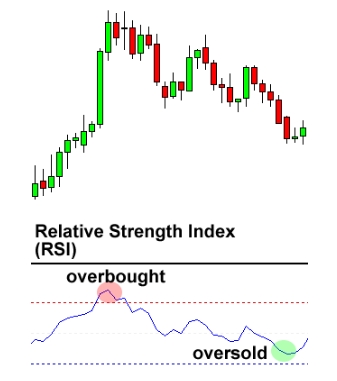
The Relative Strength Index (RSI) is a popular indicator first developed by a technical analyst named J. Welles Wilder. This indicator helps traders to assess the current market power.
The RSI is somewhat similar to Stochastic in that it identifies conditions for overselling and overselling in the market.
Labels: Order to build a Forex robot , Build a stock trading robot , Build a trading robot , Trader robot design , Free Forex Robot , Forex robot programming , Forex Expert Making Tutorial , Build a trading robot with Python , Download Forex Trading Robot , Buy Forex Trader Robot , Automated Forex Robot , Free stock trading robot , Learn how to build a Forex trading robot , Alpari trading robot , Forex robot for Android , MetaTrader robot design , MetaTrader robot programming , Forex robot design , Forex robot programming , Automated trading
It is also scaled from 0 to 100.
Typically, a number 30 or lower indicates an overselling situation and an increase in the likelihood of a price gaining (going up).
Some traders believe that an over-sold currency pair indicates that there is a possibility of a reversal of the downtrend, in other words, the opportunity to buy.
A number of 70 or higher indicates the condition of over-buying and increasing the probability of weakening the price (going down).
Some traders perceive that an over-bought currency pair indicates that there is a possibility of a reversal of the uptrend, which means that there is an opportunity to sell.
How to use the relative strength index or RSI indicator?
Intersection of RSI line and midline
In addition to the bullish and bullish indicators mentioned above, traders using the Relative Strength Index (RSI) are also looking to intersect with the hypothetical midline.
Moving below the hypothetical middle line (50) upwards indicates an uptrend.
The intersection with the center line occurs when the RSI value goes above the 50 line and moves to the 70 line. This indicates that the strength of the market trend is increasing and is considered as an uptrend as long as the RSI is approaching the 70 line.
Moving from the top of the hypothetical central line (50) downwards indicates a downward trend.
An intersection with the center line occurs when the RSI goes below the 50 scale and moves to the 30 line. This indicates that the strength of the market trend is weakening and is considered as a downtrend as long as the RSI is approaching the 30 line.
How to trade using the RSI indicator
RSI can be interpreted exactly like a stochastic indicator.
Depending on whether the market is overbought or over-sold, we can use it to identify and select potential ceilings and floors.
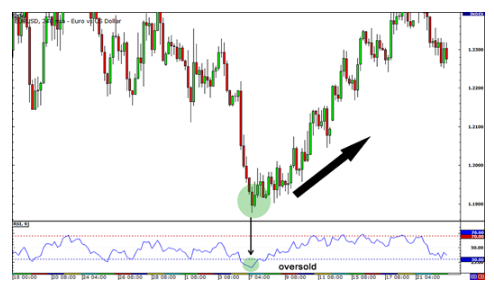
Below is a 4-hour EUR / USD chart.
How to use the relative strength index or RSI indicator?
EUR / USD has fallen all week, falling by about 400 pips in two weeks.
On June 7, the price was trading below the level of ٫ 2000.
However, the RSI fell to below 30, indicating that there are no traders left in the market and the move could be over.
Then the price returned and went up over the next few weeks.
Determine the trend using the RSI indicator
RSI is a very popular tool because it can also be used to confirm the formation of trends.
If you think a trend is forming, take a quick look at the RSI and see if it is above or below 50.
If you are looking for a potential uptrend, make sure the RSI is above 50.
If you are looking for a potential downtrend, make sure the RSI is below 50.
How to use the relative strength index or RSI indicator?
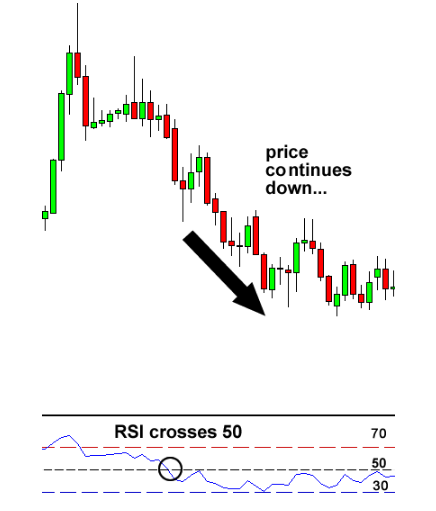
At the beginning of the chart above, we see that a possible downtrend is taking shape.
To avoid dealing with fake cases, we can wait for the RSI to cross the hypothetical midline and go below 50 to confirm our trend.
Certainly, passing the RSI below 50 would be a good confirmation that the downtrend has really taken shape.
Labels: Order to build a Forex robot , Build a stock trading robot , Build a trading robot , Trader robot design , Free Forex Robot , Forex robot programming , Forex Expert Making Tutorial , Build a trading robot with Python , Download Forex Trading Robot , Buy Forex Trader Robot , Automated Forex Robot , Free stock trading robot , Learn how to build a Forex trading robot , Alpari trading robot , Forex robot for Android , MetaTrader robot design , MetaTrader robot programming , Forex robot design , Forex robot programming , Automated trading


