

The Ichimoku Cloud Indicator is a versatile indicator that provides traders with complete information on Support and Resistance levels, trend direction and momentum at the same time. Although the Ichimoku indicator is a very powerful trading tool, most traders are confused by the information and its lines and often misinterpret its signals. In this article, we intend to fully examine this indicator and teach you how to get signals from it step by step.
Labels: Order to build a Forex robot , Build a stock trading robot , Build a trading robot , Trader robot design , Free Forex Robot , Forex robot programming , Forex Expert Making Tutorial , Build a trading robot with Python , Download Forex Trading Robot , Buy Forex Trader Robot , Automated Forex Robot , Free stock trading robot , Learn how to build a Forex trading robot , Alpari trading robot , Forex robot for Android , MetaTrader robot design , MetaTrader robot programming , Forex robot design , Forex robot programming , Automated trading
Step 1: Separate the Ichimoku indicator
The Ichimoku indicator consists of the following two different elements:
- Line conversion ( Conversion ) and base ( Base ): lines that look like moving averages on the chart are minor differences, but also with it.
- Ichimoku Cloud ( Ichimoku Cloud ) : cloud or the cloud of Ichimoku indicator is the most popular because it puts the most information to traders.
Introduction and training of ICHIMOKU indicator
In the continuation of this article, we will examine each of the elements of this indicator separately.
Conversion line and base (base)
As mentioned earlier, the conversion line and the base line are the same as moving average lines, but they do different things to them. These lines actually show the middle of the last 9 and 26 day highs and lows. In other words, these lines of 9 and 26 periods (candle) go back, then identify the highest and lowest price levels in that period and draw the line in the middle of that range.
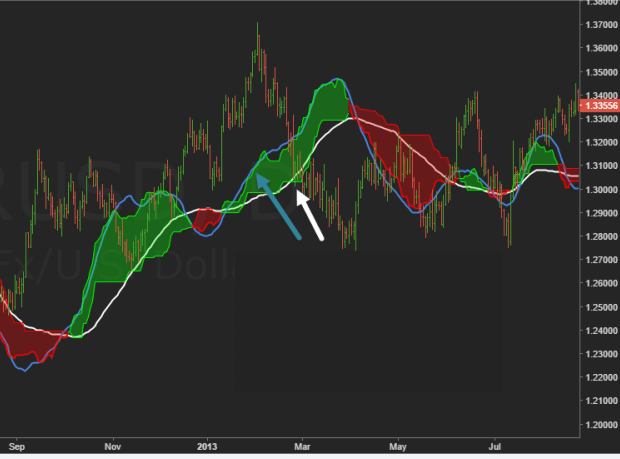
In the image below, the red and green lines show the baseline and the conversion, respectively. In addition, the 9-day moving average is also shown in white on the chart. The moving average is very similar to the conversion line but does not 100% match it.
Conversion line or Tenkan Sen : the middle of the floor and the 9-day price peak
Baseline or Kijun Sen : mid-floor and 26-day price peak
Interpretation of the conversion line and the baseline and its signals
Conversion and basis lines have two main purposes; In the first place, they act as a moving average as levels of support and resistance throughout the process. Secondly, they provide traders with information about momentum. When the stock price level is above these two lines and when the conversion line is above the baseline, it will show an upward movement to the trader.
This is just like the moving average; In fact, the passage of the short moving average over the long moving average indicates that the momentum has increased and will have an upward trend.
- Conversion and basis lines act as levels of support and resistance in the process.
- Stock buying should be done when the price level is higher than these two lines, stock selling should be done when the price level is lower than these two lines.
- The intersection of two lines with each other confirms the momentum.
- When the short line moves above the long line, the momentum will face an upward movement. Of course, the opposite will happen.
- The movement of the stock price level above these two lines will also confirm the momentum.
Ichimoku Cloud ( Ichimoku Cloud )
The Ichimoku cloud consists of two boundaries (Boundary) up and down, and the space between these two lines is usually shown in green or red. The first limit of the faster Ichimoku cloud is actually the average between the conversion and base lines. The second limit, which has a slower speed, is the average between the floor and the 52-day price peak. One of the most important features of the Ichimoku cloud is that it can predict stock price trends over the next 26 days.
In the image below, 2 normal moving averages are placed next to the cloud and the offset 26 method (moving the moving average to the next 26 days) is also used in it. As you can see in the image below, the Ichimoku cloud is about the same as the moving average.
Introduction and training of ICHIMOKU indicator
High Speed Limit or Seknou A : The average between the conversion line and the baseline
Slow Limit or Senkou B : The average between the peak and the 52-day price floor
Interpretation of the Ichimoku cloud and its signals
The basic philosophy of the Ichimoku cloud is very similar to the baseline lines because the two boundaries in the cloud are drawn based on these lines. In the first place, the Ichimoku cloud acts as a support and resistance level and provides traders with information about the direction of the trend and momentum. Of course, unlike the 9- and 26-day periods used in the conversion line, the clouds use 52-day components, so they are slower than these two lines.
In general, if the price level is higher than the cloud, it indicates an upward trend, and if it is below the cloud, it will confirm the downward trend. The space between the clouds is also the Noise area or the sudden price changes and traders should avoid trading in that area as much as possible. If the cloud is green and the downtrend is confirmed by the red cloud, then the trader realizes that there will be a rally (price increase).
In fact, it can be said that the cloud is a trading strategy for long-term trends. In general, the following should be considered when using the Ichimoku cloud:
- Trend-following trading strategy is based on which side of the price the price is on the cloud.
- Cloud border lines will act as support and resistance levels during each process.
- If the price level is in the cloud, it will indicate the Noise area.
Labels: Order to build a Forex robot , Build a stock trading robot , Build a trading robot , Trader robot design , Free Forex Robot , Forex robot programming , Forex Expert Making Tutorial , Build a trading robot with Python , Download Forex Trading Robot , Buy Forex Trader Robot , Automated Forex Robot , Free stock trading robot , Learn how to build a Forex trading robot , Alpari trading robot , Forex robot for Android , MetaTrader robot design , MetaTrader robot programming , Forex robot design , Forex robot programming , Automated trading
How to use Ichimoku indicator signals
Now that you are familiar with the components of the Ichimoku indicator, it is best to review how to use it in technical analysis.
1- Cloud: long-term trend, resistance and color
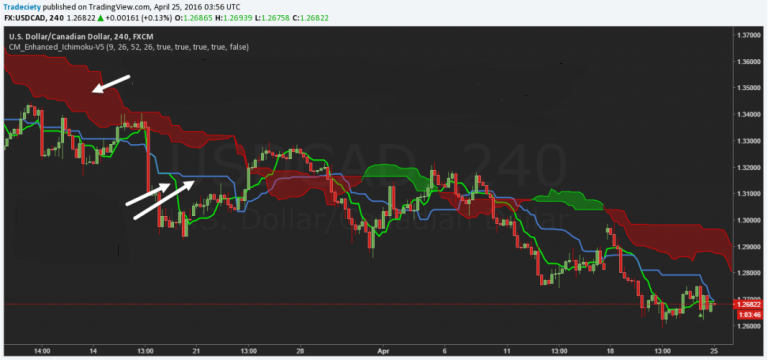
With the help of the Ichimoku cloud, traders can easily distinguish between long-term uptrends and downtrends. When the price level is below the cloud, it will strengthen the downtrend and if it is above the cloud, it will strengthen the uptrend. The Ichimoku cloud also acts as a level of support and resistance in powerful trends; For example, the image below clearly shows how the price level rejects the cloud during the wavelengths of the process.
In other words, the cloud is a very ideal option to identify the differences between the ascending and descending phases of the market. Of course, keep in mind that Ichimoku clouds, like most momentum indicators, will lose their credibility in the Range markets.
Introduction and training of ICHIMOKU indicator
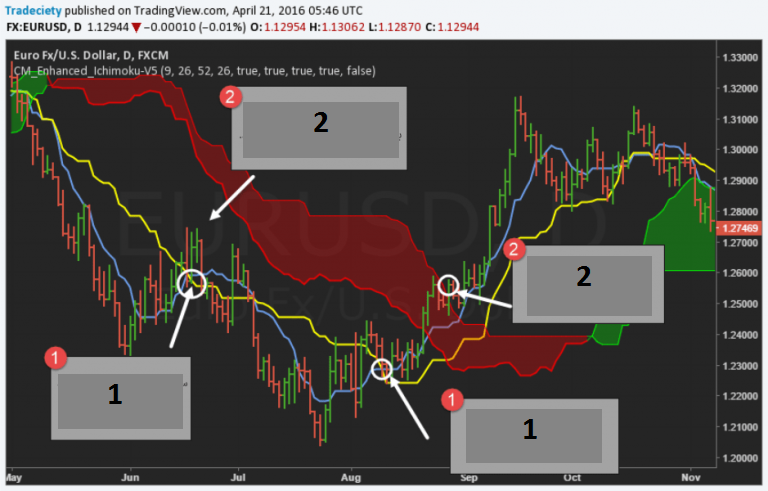
2- Conversion line signals and high speed base
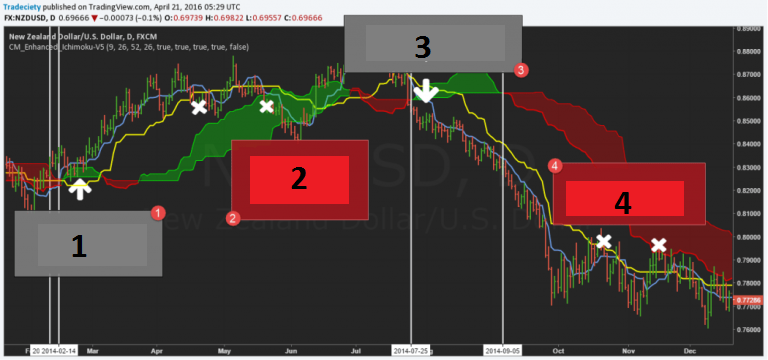
The baseline is the fastest component of the Ichimoku indicator that provides early momentum signals to traders. In the picture below, 4 different points have been identified, and we will examine each of them in the following.
Introduction and training of ICHIMOKU indicator
- Number 1: The conversion line crosses the baseline, which indicates an uptrend. In this case, the price level will move above the two lines, which will confirm the uptrend. Then the price level returns to the cloud for a very short time but finds the support level. This can be interpreted as a signal to enter the market.
- Number 2: The price level starts to penetrate the baseline (yellow) which will be considered as a warning to change the direction of the trend. The conversion and baseline lines also cross the downtrend, which will also confirm the momentum change. The price level eventually enters the cloud, which indicates the validation of the changes.
- Number 3: The price level passes below the change and baseline with great intensity and the conversion line also crosses the baseline, both of which indicate bearish signals. At the same time, the price level is trading below the cloud. All the signals mentioned show a sharp downward trend that can be interpreted as a sell signal.
- Number 4: The price level has started to penetrate the slow baseline, which is interpreted as an early warning signal. Then the conversion and baseline lines continue to cross each other, which sends a momentum change signal to traders. Eventually the momentum stopped and the price level was fixed on one side.
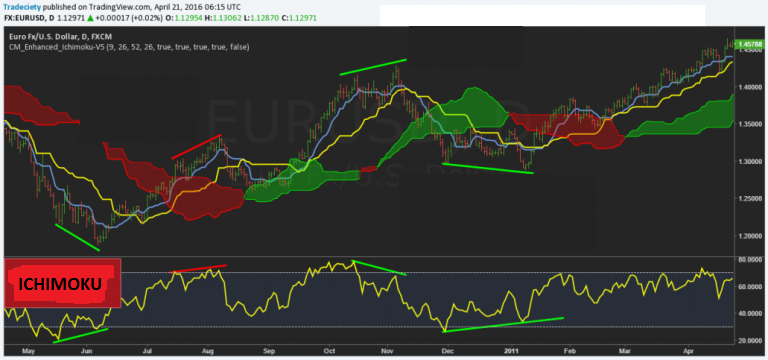
3- RSI index and creating a combination ( Confluence )
We all seek to create more powerful trading methods by combining different tools and concepts. One of the best tools available to make a strong combination with Ichimoku is the RSI indicator, or relative strength. In fact, when you use the Ichimoku indicator to monitor a trend, you need to know when the trend ended and when a possible reversal signals the exit signal.
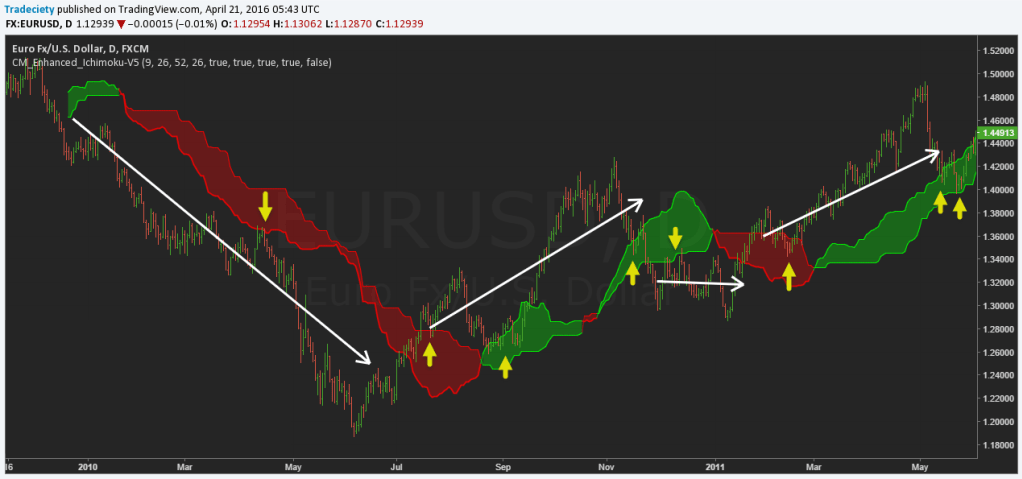
The image below shows how adding a RSI index and then searching for its divergence can identify very likely returns. If the price level crosses the baseline after the RSI diverges, then the probability of a return is very high. This could even signal a reversal of the long-term trend in the opposite direction.
Introduction and training of ICHIMOKU indicator
4- Stop Placement and exit from transactions
Just like the moving average, the Ichimoku indicator can also be used to identify stop and exit points. You should pay attention to the following points when leaving the trades in the following trends based on Ichimoku signals:
Introduction and training of ICHIMOKU indicator
- If in the downtrend the price level crosses above the conversion and base lines, it will indicate a temporary change signal in the momentum.
- Of course, as long as the cloud remains as resistance levels, the trend will not be broken.
- When the price level breaks above the cloud, the downtrend will eventually end.
- Traders can use the Ichimoku indicator to exit the conservative exit and the aggressive exit.
Conservative exit means that the trader leaves his trading position by observing the crossing of the conversion lines and the base in the opposite direction of the trend. In a quick exit, the trader leaves the trade only when the price level is broken in the opposite direction of the cloud.
Conclusion
As we mentioned at the beginning of the article, the Ichimoku indicator is a multifunctional indicator that provides traders with comprehensive information on a stock’s price trend. Using this indicator is as simple as the moving average strategy, but in general, when working with this indicator, you should pay attention to the following points.
- Use the Ichimoku cloud to identify the direction of the long-term trend and perform your transactions in the direction of the cloud.
- The cloud acts as a level of resistance and support during the process, but the entry of the price level into the cloud will indicate a change in momentum.
- Crossing the conversion line above the baseline indicates that the trend will move upwards.
- Try to do your trading only on conversion and basis lines.
- The trader can use the conversion lines or the base (conservative exit) to exit the market or they can leave the market quickly and observe the failure of the price balance in the cloud.
- The Ichimoku indicator will lose credibility in neutral or suffering markets.
Labels: Order to build a Forex robot , Build a stock trading robot , Build a trading robot , Trader robot design , Free Forex Robot , Forex robot programming , Forex Expert Making Tutorial , Build a trading robot with Python , Download Forex Trading Robot , Buy Forex Trader Robot , Automated Forex Robot , Free stock trading robot , Learn how to build a Forex trading robot , Alpari trading robot , Forex robot for Android , MetaTrader robot design , MetaTrader robot programming , Forex robot design , Forex robot programming , Automated trading


