

The standard method of calculating pivot points is not the only way to calculate pivot points.
Traders have been working on improving the method of identifying the original pivot point, and now they have other methods for calculating the pivot point.
In this lesson, we will talk about other methods, as well as formulas for calculating these levels.
Labels: Order to build a Forex robot , Build a stock trading robot , Build a trading robot , Trader robot design , Free Forex Robot , Forex robot programming , Forex Expert Making Tutorial , Build a trading robot with Python , Download Forex Trading Robot , Buy Forex Trader Robot , Automated Forex Robot , Free stock trading robot , Learn how to build a Forex trading robot , Alpari trading robot , Forex robot for Android , MetaTrader robot design , MetaTrader robot programming , Forex robot design , Forex robot programming , Automated trading
Woodie pivot points
R2 = PP + floor – ceiling
R1 = (2 X PP) – floor
PP = (H + L + 2C) / 4
S1 = (2 X PP) – ceiling
S2 = PP – floor + ceiling
(C = closing price , H = ceiling , L = floor)
In the above formulas you will see that the calculation of the pivot point is very different from the calculation with the standard method.
Also, to calculate the level of support and resistance, you can use the difference between the ceiling and the floor of the previous day, which is known as the range or range.
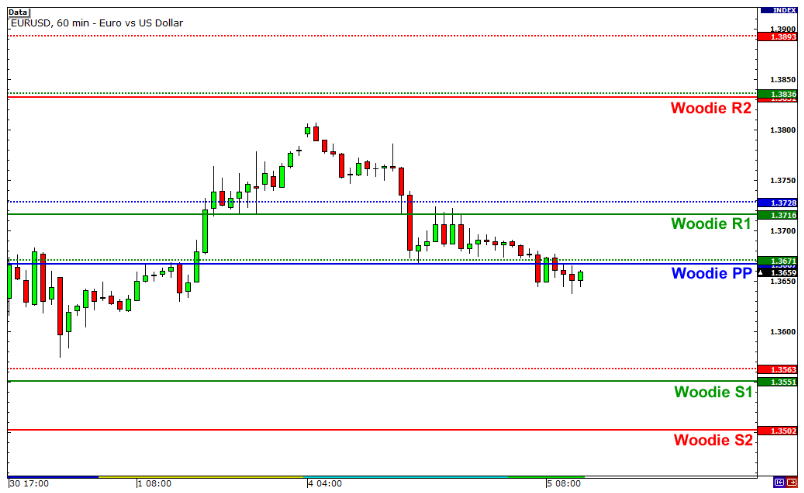
The following is an example diagram of the Woodie Pivot calculation for EURUSD.
Pivot points (dry Woodie) are actually solid lines or support levels and resistance levels, and dotted lines represent the levels calculated by the standard method.
Meet Pew Point Woodie, Camarilla and Fibonacci
Because they have different formulas, the levels obtained from Woodie calculations are very different from the values obtained through the standard method.
Some traders prefer to use Woodie formulas because they give more weight to the closing price of the previous period.
Others prefer standard formulas because many traders use these formulas, which can make them work on their own.
In any case, since resistance becomes support (and vice versa), if you use Woodie formulas, you should keep an eye on these levels as they may become areas of interest for traders. In short, do whatever satisfies you and suits you!
Camarilla Pivot Points
R4 = C + ((HL) x 1.5000)
R3 = C + ((HL) x 1.2500)
R2 = C + ((HL) x 1.1666)
R1 = C + ((HL) x 1.0833)
PP = (H + L + C) / 3
S1 = C – ((HL) x 1.0833)
S2 = C – ((HL) x 1.1666)
S3 = C – ((HL) x 1.2500)
S4 = C – ((HL) x 1.5000)
(C = closing price , H = ceiling , L = floor)
Camarilla formulas are similar to Woodie formulas. They also use yesterday’s range and close to calculate the level of support and resistance.
The only difference is that you have to calculate for the 8 main levels (4 resistances and 4 supports), and each of these levels must be multiplied by a certain coefficient.
The basic premise of Camarilla pivot points is that it is based on the assumption that the price has a natural tendency to go back to the middle, or in this example, the close of yesterday.
The assumption is that when the price reaches the level of support or third resistance, you should buy or sell.
However, if the price inevitably goes beyond the S4 or R4, it means that the daily trend is strong and it is time for you to board the train!
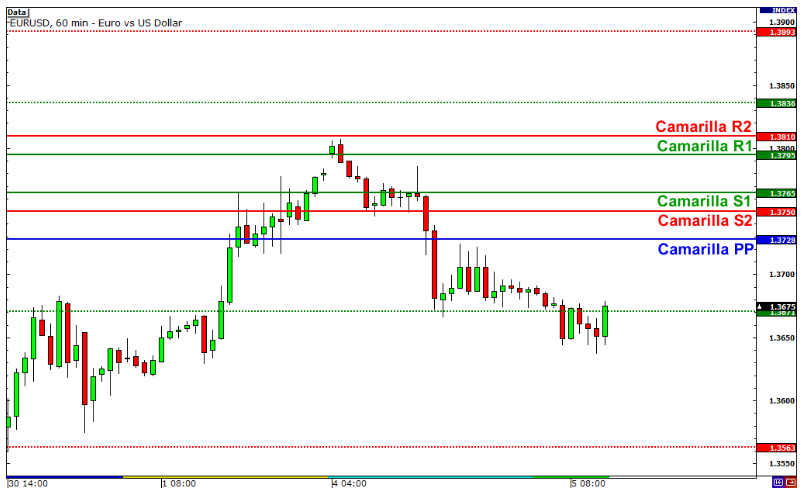
See how the Camarilla compute offers different levels (solid lines) compared to the levels obtained from the standard method (dotted lines)!
Meet Pew Point Woodie, Camarilla and Fibonacci
As you can see in the chart above, unlike the pivot point, the emphasis is more on the closing price.
For this reason, resistance levels may be below the pivot point or above the support level.
Do you see how all the support and resistance levels are above the Camarilla pivot point?
Fibonacci pivot points
R3 = PP + ((floor-ceiling) x 1,000)
R2 = PP + ((floor-ceiling) x .618)
R1 = PP + ((floor-ceiling) x .382)
PP = (H + L + C) / 3
S1 = PP – ((floor-ceiling) x .382)
S2 = PP – ((floor-ceiling) x .618)
S3 = PP – ((floor-ceiling) x 1,000)
(C = closing price , H = ceiling , L = floor)
Fibonacci first pivot levels are determined by calculating the pivot point similar to the standard method.
And then, you have to multiply the previous day’s range by the corresponding Fibonacci level. Most traders use 38.2%, 61.8% and 100% retry in their calculations.
Finally, add or subtract the resulting numbers to the pivot point, and that’s it! Fibonacci pivot level at your service!
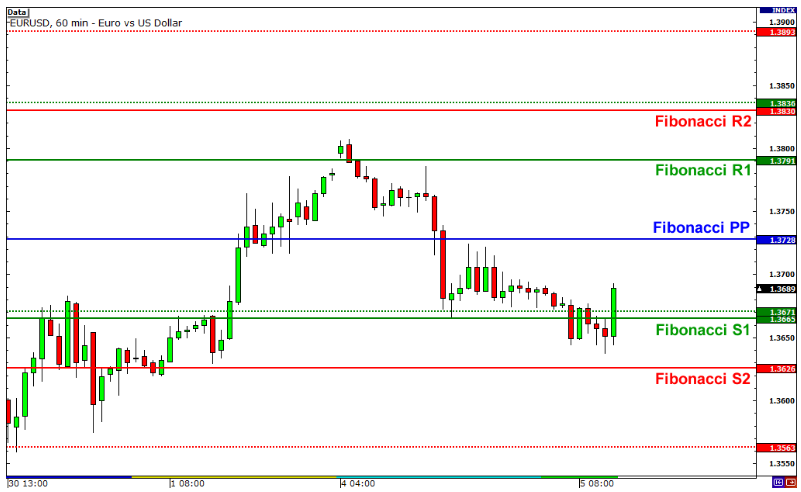
Look at the diagram below to see how the levels calculated using the Fibonacci method (solid lines) differ from the values calculated using the standard method (dotted lines).
Meet Pew Point Woodie, Camarilla and Fibonacci
The rationale behind the Fibonacci pivot is that many traders like to use Fibonacci ratios. Traders use them for correction levels, moving averages and so on.
So why not use them for pivot points?
Remember that both Fibonacci levels and Pivot levels are used to find support and resistance.
Given that many traders monitor these levels and react to them, they can act for this reason.
Which method of calculating pivot levels is better?
The truth is that, just like the types of indicators you learned earlier, there is no best way.
In fact, it all depends on how you combine your knowledge of pivot points with other tools in your trading toolbox.
Just know that most technical software that performs automated calculations typically uses the standard method of calculating pivot levels.
But now that you know how to calculate these levels yourself, you can change them all and see which one works best for you.
We will soon introduce you to a useful indicator for calculating and plotting pivot points.
Labels: Order to build a Forex robot , Build a stock trading robot , Build a trading robot , Trader robot design , Free Forex Robot , Forex robot programming , Forex Expert Making Tutorial , Build a trading robot with Python , Download Forex Trading Robot , Buy Forex Trader Robot , Automated Forex Robot , Free stock trading robot , Learn how to build a Forex trading robot , Alpari trading robot , Forex robot for Android , MetaTrader robot design , MetaTrader robot programming , Forex robot design , Forex robot programming , Automated trading


