

Three types of graphs widely used in technical analysis
There are three main types of charts that investors and traders use, depending on the information they seek or their individual skill levels. These charts include line charts, bar charts, candlestick charts.
Before getting acquainted with the types of charts, it is necessary to get acquainted with OHLC charts.
Labels: Order to build a Forex robot , Build a stock trading robot , Build a trading robot , Trader robot design , Free Forex Robot , Forex robot programming , Forex Expert Making Tutorial , Build a trading robot with Python , Download Forex Trading Robot , Buy Forex Trader Robot , Automated Forex Robot , Free stock trading robot , Learn how to build a Forex trading robot , Alpari trading robot , Forex robot for Android , MetaTrader robot design , MetaTrader robot programming , Forex robot design , Forex robot programming , Automated trading
OHLC diagrams
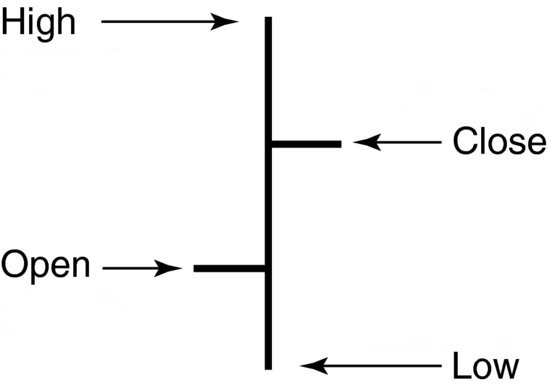
Charts (OHLC) are charts that display four prices: open price (OPEN), closed price (CLOSE), high price (HIGH) and low price (LOW) that line charts lack. We put.
Open price (OPEN)
The first price to be traded in a trading interval
Package price (CLOSE)
It is the last price at which a trade price has been made in a trading interval.
HIGH PRICE
It is the highest price in which a trade price has been made in a trading interval.
Low price (LOW)
It is the lowest price at which a trade price has been made in a trading interval.
Examples of these 4 prices and a trading range
Linear graph
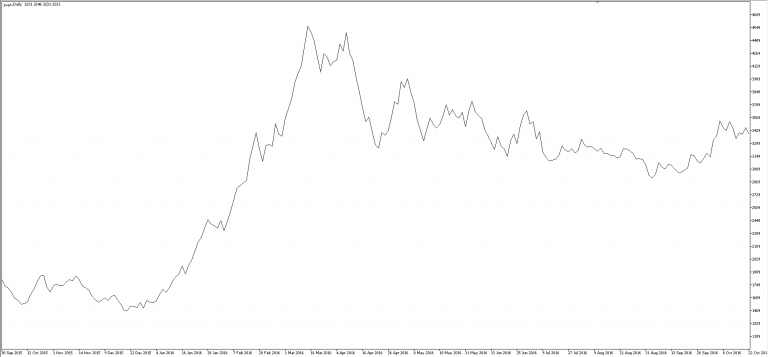
The simplest type of these four charts is the line chart, because it only shows the closing prices of a trading interval, for example, the close price in one day makes a point of the line chart for us, and this line, by connecting the price Closures are created. Line charts do not provide any other information about the range of trading fluctuations in a time period such as high, low and open prices. Because the closing price is the most important price in stock changes, line charts often use this price to plot it. Although in different software this issue can be adjusted at what price the chart is drawn, but in general this issue is not important and it is better to use the software default.
Price charts in technical analysis, line charts, bar charts and candlesticks
Bar graph
A bar chart is added to a bar chart by adding more basic information to each data point. The diagram is made up of a series of vertical lines that represent each data point. This vertical line shows the high price and low price in the trading range along with the close price and the open price. The open and closed prices are shown on the vertical line with a horizontal dash. The open price is shown on the bar chart with a dashed line to the left of the vertical bar. Conversely, the closed price is indicated by a dash on the right. Usually, if the left (open) dash is lower than the right (closed) dash, then it is a bullish bar, indicating that the stock has grown in that trading interval. A bar with a bearish signal has fallen in value during that period. When this happens, the dash on the right (closed) is lower than the dash on the left (open).
Price charts in technical analysis, line charts, bar charts and candlesticks
Ascending and descending bar
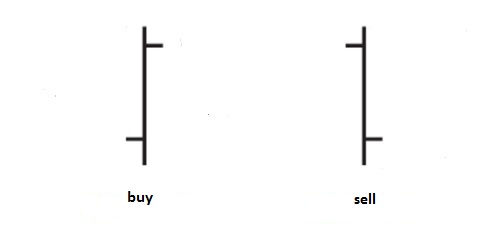
The image above shows how to display four prices in a trading interval in a bar, but in the image below you can also see the shape of two ascending and descending bars.
Price charts in technical analysis, line charts, bar charts and candlesticks
As you can see in the picture above, our bar has two ascending and descending states. The difference between these two states is in the place of opening and closing. When the price bar is on the right, OPEN is higher than CLOSE, indicating that the price has been declining at the end of the day, and that the price bar is bearish.
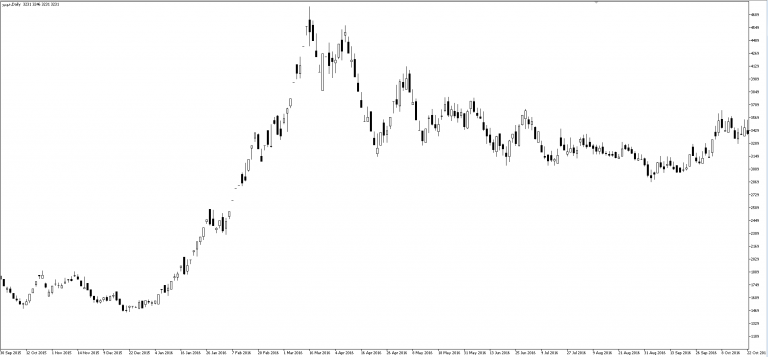
Sample bar chart

Price charts in technical analysis, line charts, bar charts and candlesticks
Candle chart
To many traders, a candlestick chart is visually more interesting and easier to interpret than a bar chart (although both are OHLC charts). Each candle provides images of price movements that are easy to decode in the chart. In a bar chart, the analyst is able to easily examine and compare the relationship between the start and end prices as well as the highest and lowest prices, and has a more tangible appearance than the bar chart.
Price charts in technical analysis, line charts, bar charts and candlesticks
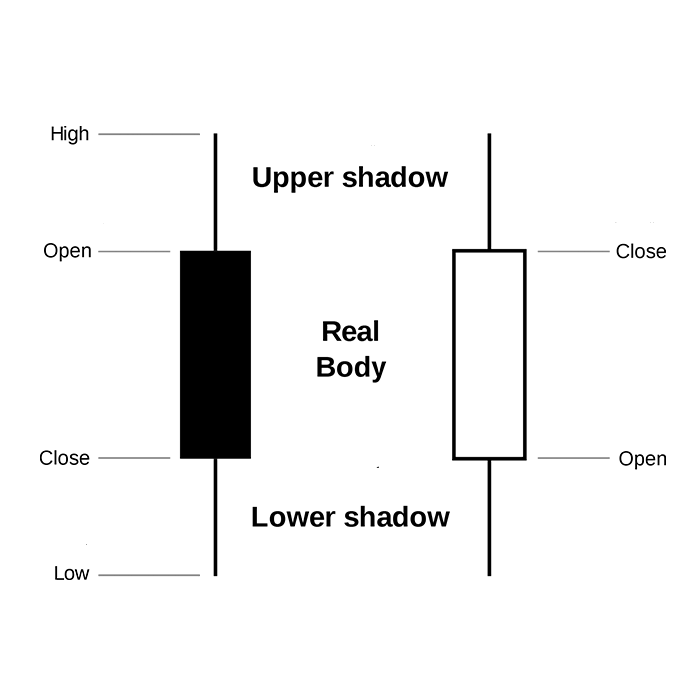
The candlestick chart is similar to the bar chart, but the way it is displayed is different. Similar to the bar chart, the candlestick chart also has a deliberate narrow line that shows the trading period in the period. The difference in the formation of a wide rectangle on the vertical line is the difference between the opening and closing of the price. , The color chart shows the direction of the trade well. Software and color analysts use different colors to represent an ascending or descending candle; Of course, with a simple glance, you can tell which candle is rising and which is falling. . When the stock price rises and the closing price is above the open price, our candle will usually be white or light. If the stock falls in that candle, the chart usually turns red or black.
Price charts in technical analysis, line charts, bar charts and candlesticks
Labels: Order to build a Forex robot , Build a stock trading robot , Build a trading robot , Trader robot design , Free Forex Robot , Forex robot programming , Forex Expert Making Tutorial , Build a trading robot with Python , Download Forex Trading Robot , Buy Forex Trader Robot , Automated Forex Robot , Free stock trading robot , Learn how to build a Forex trading robot , Alpari trading robot , Forex robot for Android , MetaTrader robot design , MetaTrader robot programming , Forex robot design , Forex robot programming , Automated trading


