

Technical analysis counts on the repetition of price behavior. These repetitive behaviors create patterns that either continue the price trend or change the price direction, in which case we are faced with a return pattern. Knowing these patterns can help us better understand trading opportunities. In this article, we introduce recursive patterns and their types, such as twin and triple roof and floor, and head and shoulders, and explain the targeting method in each of them.
Labels: Order to build a Forex robot , Build a stock trading robot , Build a trading robot , Trader robot design , Free Forex Robot , Forex robot programming , Forex Expert Making Tutorial , Build a trading robot with Python , Download Forex Trading Robot , Buy Forex Trader Robot , Automated Forex Robot , Free stock trading robot , Learn how to build a Forex trading robot , Alpari trading robot , Forex robot for Android , MetaTrader robot design , MetaTrader robot programming , Forex robot design , Forex robot programming , Automated trading
Investigation of return patterns of technical analysis
In technical analysis, we have three recursive patterns, each of which we will explain on the image. These three patterns are:
- Twin floors and ceilings
- Triple floor and ceiling
- Head and shoulders on the ceiling or head and shoulders inverted on the floor
Twin roof
Recursive patterns in technical analysis
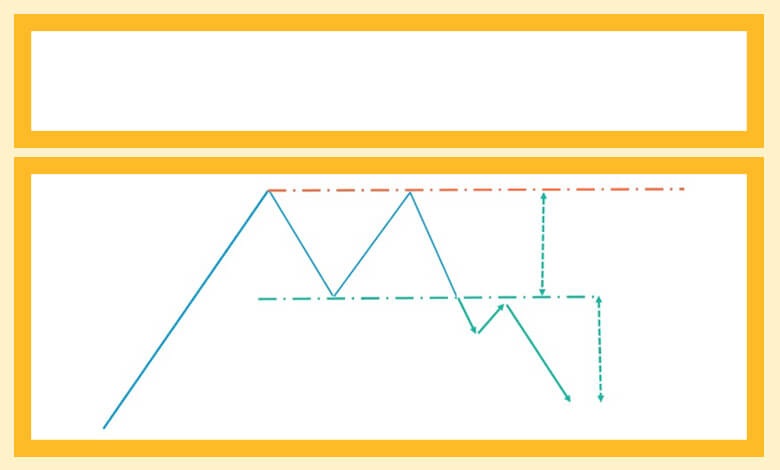
The first of the recursive patterns is called twin floor and ceiling technical analysis. This pattern is very similar to the rectangular pattern that we talked about earlier in the article “Continuing Patterns in Technical Analysis”. Sometimes when an uptrend occurs in a stock, the price fluctuates between two parallel levels. But if the stock continues to move from the upper side and in the direction of the previous trend, we call it a rectangular pattern.
In the other case, if, as in the figure above, the failure occurs from the bottom side and in fact the support line is broken, the twin roof pattern will be created. Thus the existence of this pattern is a sign of the end of a process. For example, in this image, you can see the end of the uptrend. This happens when there is a failure in the support line.
To target this pattern, we also need to measure the height between the floor and the ceiling. Given this height, we expect to see at least this amount of price correction in the stock. In many cases, the price may fall more than this amount.
In general, the return patterns of technical analysis are a confirmation of the end of the previous movement of the stock. Here, looking at this pattern, we understand that the uptrend has ended at this point. In this way, the twin roof pattern shows us the beginning of the downtrend.
But if you have this share in your portfolio now and you want to get out of it, you should not rush. You should only do this if the support line fails. Because if the stock price grows before the break of support and there is an upward trend, there is a possibility of creating a rectangular pattern. In such a situation, if we have already left the share, we will be deprived of a desirable profit.
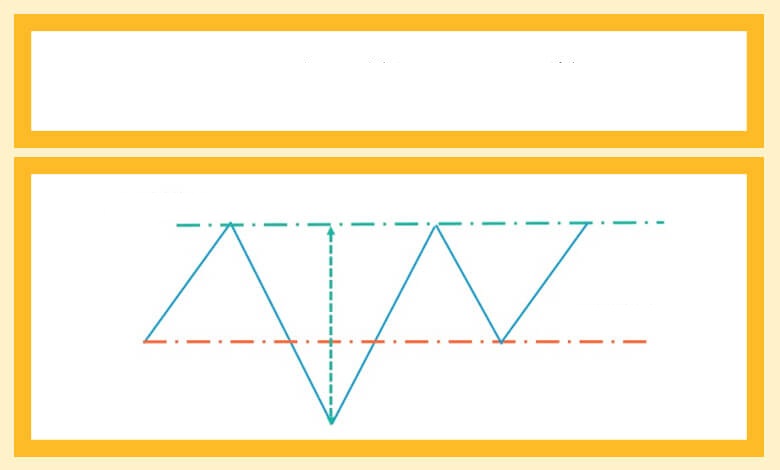
Twin floor
Recursive patterns in technical analysis
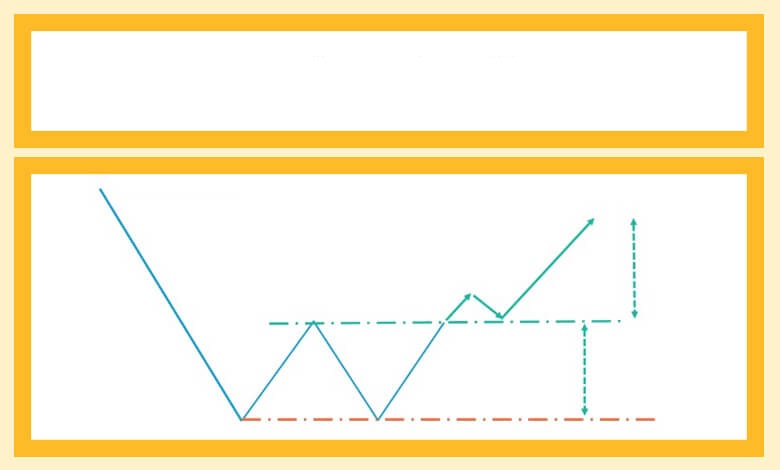
The twin floor pattern is formed when at the end of a downtrend we have price fluctuations between the two levels of support and resistance. The reaction to the support level then occurs twice. This is how the so-called twin floor is created.
This pattern is one of the most important types of return patterns that can give us a good buying opportunity. For this purpose it is necessary to break the resistance surface. But it should be noted that buying and selling should not be done until the end of the pattern. Targeting in this situation is exactly the same as before. Again, we need to measure the distance between support and resistance. We can expect the same amount of price growth from the share.
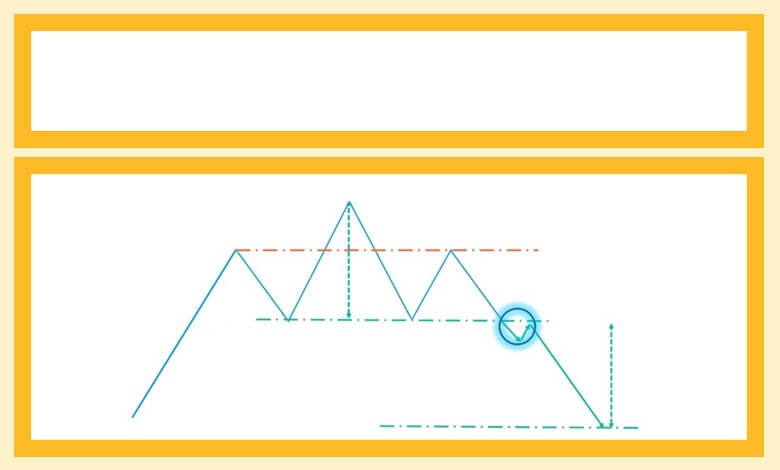
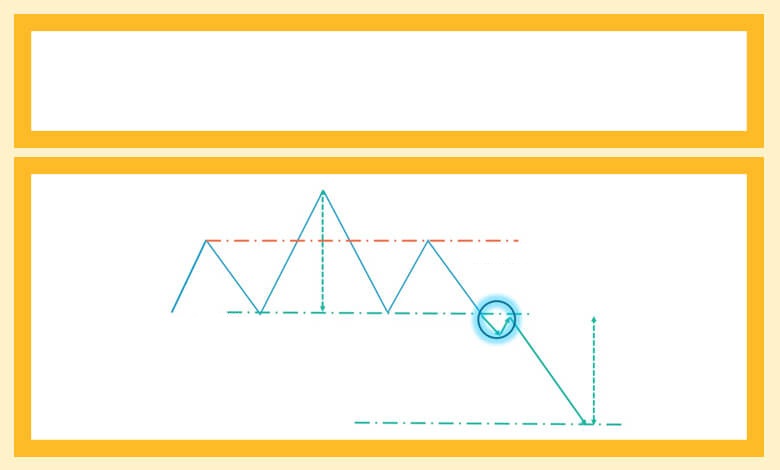
Triple floor and ceiling

Recursive patterns in technical analysis
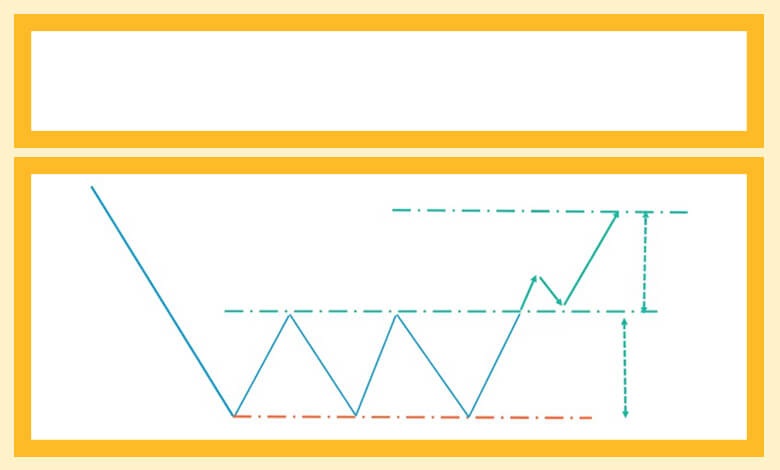
Another recurring pattern is the technical analysis of the triple floor and ceiling. It is clear that this pattern is very similar to the previous pattern. The only difference is that instead of two floors, in this pattern we see the formation of three floors. Or instead of having two roofs, we will have three. In this image, you can see that the stock price chart deals with the support and resistance levels of the three. Eventually, failure occurs from the bottom and we see the price fall. Targeting this pattern is like a twin roof. That is, we expect the stock to improve as much as the gap between support and resistance.
Recursive patterns in technical analysis
On the floor, just like before, we see three collisions. But failure happens from the top. Thus, we expect the share to return after this move and the price to grow as much as the previous target.
Head and shoulders inverted on the floor
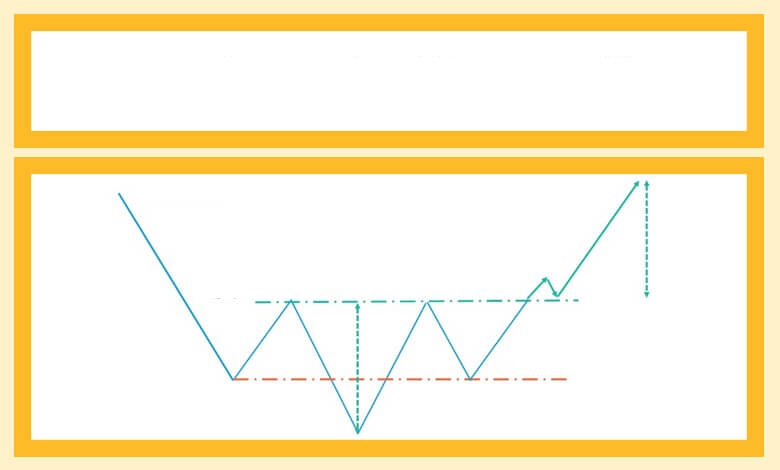
Another type of recurring pattern that is very common is called the head and shoulder pattern on the ceiling or the reverse head and shoulder pattern on the floor. These patterns have higher targets compared to the twin and triple floors. If you look closely at this image, you will see the reverse head and shoulders. Here two shoulders and one head are clearly visible.
Recursive patterns in technical analysis
The red line in the image shows the shoulder line and the green line refers to the neck line. The price fluctuations in this pattern are such that after one correction, we will have more correction. Then we see the price rise again. In this part, the share will be re-entered as much as the previous correction, which will eventually lead to the formation of a shoulder line. The neckline is the same resistance range that the price has hit twice.
Labels: Order to build a Forex robot , Build a stock trading robot , Build a trading robot , Trader robot design , Free Forex Robot , Forex robot programming , Forex Expert Making Tutorial , Build a trading robot with Python , Download Forex Trading Robot , Buy Forex Trader Robot , Automated Forex Robot , Free stock trading robot , Learn how to build a Forex trading robot , Alpari trading robot , Forex robot for Android , MetaTrader robot design , MetaTrader robot programming , Forex robot design , Forex robot programming , Automated trading
This pattern is confirmed when a neckline failure occurs. In this case, we can make our purchase and enter the share. The relatively large head-to-neck distance is considered the target of the share and we expect the price to rise as well. This will bring good returns to shareholders and generate good buy signals.
It should not be forgotten that the shoulder line will sometimes be horizontal. In such cases, the neckline can increase the validity of the chart and be a heavy burden on the share. This way you can rely on the analysis and enter the share with more confidence.
The best opportunity to buy a stock is after the neckline breaks. Buying in this area reduces transaction risk and brings relatively good returns.
Head and shoulders on the ceiling
Recursive patterns in technical analysis
Another issue with the technical analysis recursive patterns is the inverse of the previous pattern shown in the figure. Here we see the formation of a head and two shoulders left and right that form the shoulder line. When the neckline is broken, there will be a good opportunity to leave the stock. In such a situation, since we expect a further drop in the share, we must leave the share completely.
The head and shoulder pattern, of course, is not limited to these two types. In addition to the head and shoulder pattern on the ceiling and the inverted head and shoulder pattern on the floor, there are two other types of head and shoulder patterns with the letters inverted head and shoulder pattern on the ceiling and head and shoulder on the floor, which are non-recurring and continuous patterns. . In the following, we will explain these two patterns.
Inverted head and shoulder pattern on the ceiling
We said that the head and shoulders on the ceiling and the head and shoulders on the floor are two return patterns. But the head and shoulders on the floor and the head and shoulders on the ceiling are in the category of continuous patterns.
If the reverse head and shoulder pattern occurs on the floor, we expect, according to the definitions of the return pattern, to see an upward movement in the stock after the neckline breaks. In this way, we will wait for the beginning of a new uptrend.
Recursive patterns in technical analysis
But what if these moves do not occur at the end of a downtrend? This means that sometimes this move may be seen at the end of an uptrend and we will encounter such a pattern after a price increase. In such cases, the model plays the role of a continuing model. Simply put, when faced with the pattern above, we expect price growth after the neckline breaks. In this case, it does not matter if the price has fallen before or the price trend has been upward. In general, seeing such a pattern and the subsequent failure of the neckline issues a buy signal.
Pattern of head and shoulders on the floor
Exactly the opposite can happen. We said that the head and shoulder pattern usually occurs after an upward movement. In this way, after breaking the neckline downwards, the uptrend will end and we will have a price drop in the mentioned share.
Recursive patterns in technical analysis
But if instead of this pattern occurs at the end of an uptrend, it can be seen as a continuation of a downtrend. That is, after a drop in a share, we may see such a pattern. In that case, we should expect the stock to continue to fall downwards after the break from the neckline. In other words, when we see the pattern shown in the image above, regardless of whether the stock is moving up or down before, after the neckline breaks, a stock exit signal will be issued.
Conclusion
Recursive patterns are one of the types of patterns in technical analysis. These analytical patterns, as the name implies, are a sign of a change in the direction of the price trend. The types of recursive patterns are twin and triple and triple roof and floor and head and shoulders in the ceiling, each of which has its own method of targeting and the minimum amount of contribution correction can be detected using these patterns.
By recognizing the recurring patterns of technical analysis, we can find and trade favorable trading opportunities. The buy and sell signals generated by examining these patterns help us to manage our assets optimally and make low-risk and high-yield transactions.
Labels: Order to build a Forex robot , Build a stock trading robot , Build a trading robot , Trader robot design , Free Forex Robot , Forex robot programming , Forex Expert Making Tutorial , Build a trading robot with Python , Download Forex Trading Robot , Buy Forex Trader Robot , Automated Forex Robot , Free stock trading robot , Learn how to build a Forex trading robot , Alpari trading robot , Forex robot for Android , MetaTrader robot design , MetaTrader robot programming , Forex robot design , Forex robot programming , Automated trading


