
The RSI or Relative Strength Index is one of the most widely used topics in technical analysis. Today, we are going to teach you how to get signals and related strategies by briefly reviewing this indicator.
What is an RSI Indicator?
The RSI is a relative strength indicator and a momentum indicator used in technical analysis. This index measures the recent price movement of a stock or asset to assess the conditions of oversold or overbought at the price of a stock or asset. The RSI indicator fluctuates between 0 and 100 levels, so it is included in the Oscillator category. In the following, we will focus more on how the signal is received and the strategies related to the RSI indicator.
Labels: Order to build a Forex robot , Build a stock trading robot , Build a trading robot , Trader robot design , Free Forex Robot , Forex robot programming , Forex Expert Making Tutorial , Build a trading robot with Python , Download Forex Trading Robot , Buy Forex Trader Robot , Automated Forex Robot , Free stock trading robot , Learn how to build a Forex trading robot , Alpari trading robot , Forex robot for Android , MetaTrader robot design , MetaTrader robot programming , Forex robot design , Forex robot programming , Automated trading
Identify sales saturation and purchase saturation status
The RSI indicator is one of the most popular indicators for identifying opportunities to buy or sell stocks and assets. Of course, keep in mind that using an indicator alone is not enough to invest in financial markets such as the stock market and Forex.
This tool actually measures the acceleration and direction of price movements, the horizontal axis of the RSI indicator shows the time and the vertical axis shows the numerical range between 0 and 100. A number above 50 means that the market is moving upwards and a number below 50 indicates that it is down.
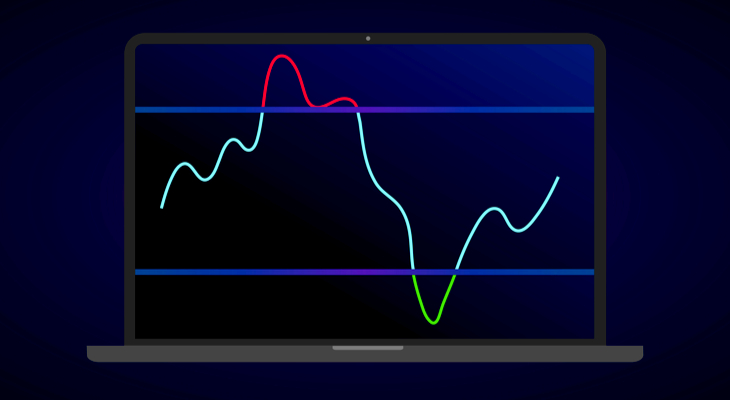
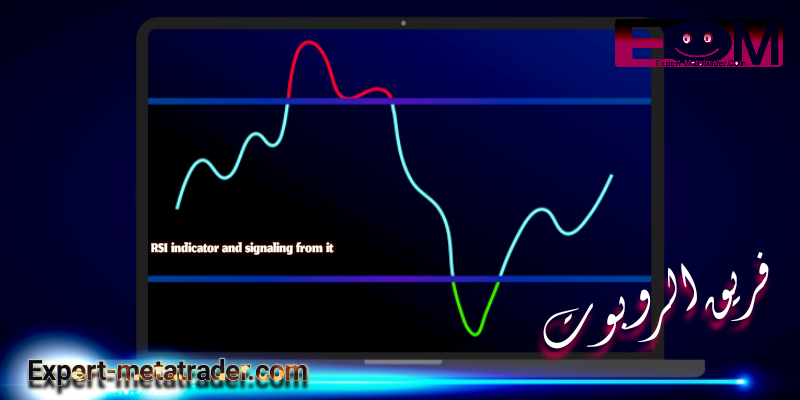
RSI indicator and signaling from it
The general rule in RSI is that if the index number goes above 70, the buy saturation actually takes place and the sell signal is received from this indicator. In other words, it shows the trader that the price has already risen sharply once in a relatively limited period of time, and in fact more than that share or currency pair has been bought. So it will be reduced temporarily.
The opposite of this process occurs when the index number is less than 30, which indicates the saturation of sales, and we can take the buy signal from it. In this case, the price of the asset or stock will fall sharply and it will be more likely to increase temporarily in the future.
RSI indicator and signaling from it
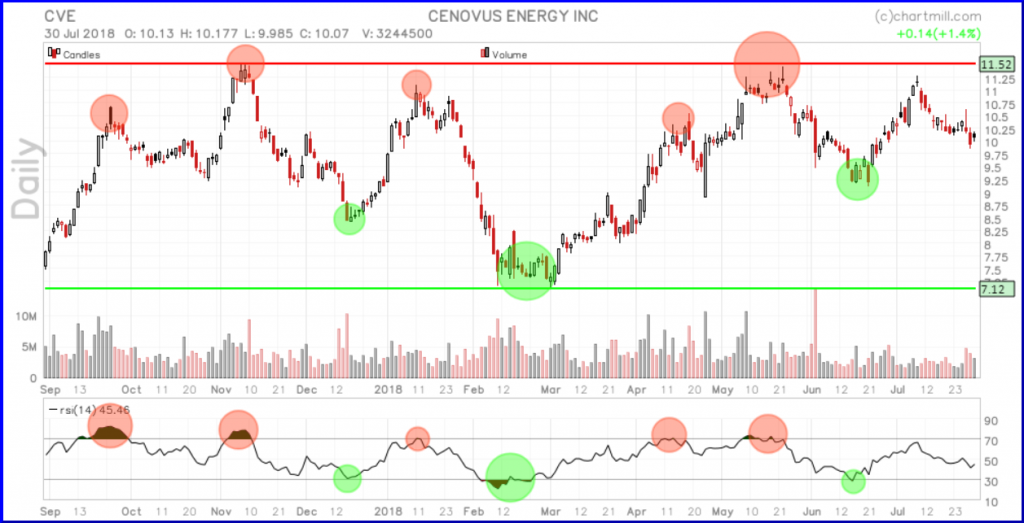
As you can see in the image above, the red circles actually represent the conditions that the sales signal indicator sends, and the green circles also represent the buy signals. In fact, any trader who has bought his stock in the green spots and sold it in the red spots has made a very good profit in this trade.
In addition, you can use RSI as a trend indicator. In general, if the RSI value is more than 50, it will be an uptrend and if the RSI value is less than 50, it will be a downtrend.
As we mentioned at the beginning of this article, you can not use an indicator to determine when to buy and sell your assets. See the chart below for more details:
RSI indicator and signaling from it
If a trader sells his stock based on the sell signals in the chart above, he will not actually make much profit. In the image above, it is clear that if the stock shows a strong trend, the RSI indicator will not send a good signal. In the event that the trend is strongly bullish, the trader should carefully examine the sell signals. Of course, even if the trend is sharply declining, the relevant stocks should not be bought as soon as the buy signal is seen, and other indicators should be used to be sure.
Using the RSI indicator in one-way markets, downtrends and uptrends
In this section, we will introduce you to three different ways to use RSI in your personal trading strategy. In the previous sections of the article, we noted that the validity of the RSI indicator strongly depends on the market or stock phase, which we have divided into the following three sections:
- The price level is in a sideway or consolidation zone.
- The price balance has a very clear uptrend.
- The price balance contains a very clear downward trend.
-
Neutral or lateral trend:
In this method, the traditional buying and selling strategy is approved, so that if the RSI is less than 30, the trader will make a purchase and if the indicator shows more than 70, he will sell the relevant shares.

RSI indicator and signaling from it
For example, in the image above, it is clear that the stock price fluctuates in a very wide price channel between $ 11.50 to $ 7, and the price level has increased or decreased sharply with each approach to these figures; The RSI indicator in this case gives the correct signal to the trader.
-
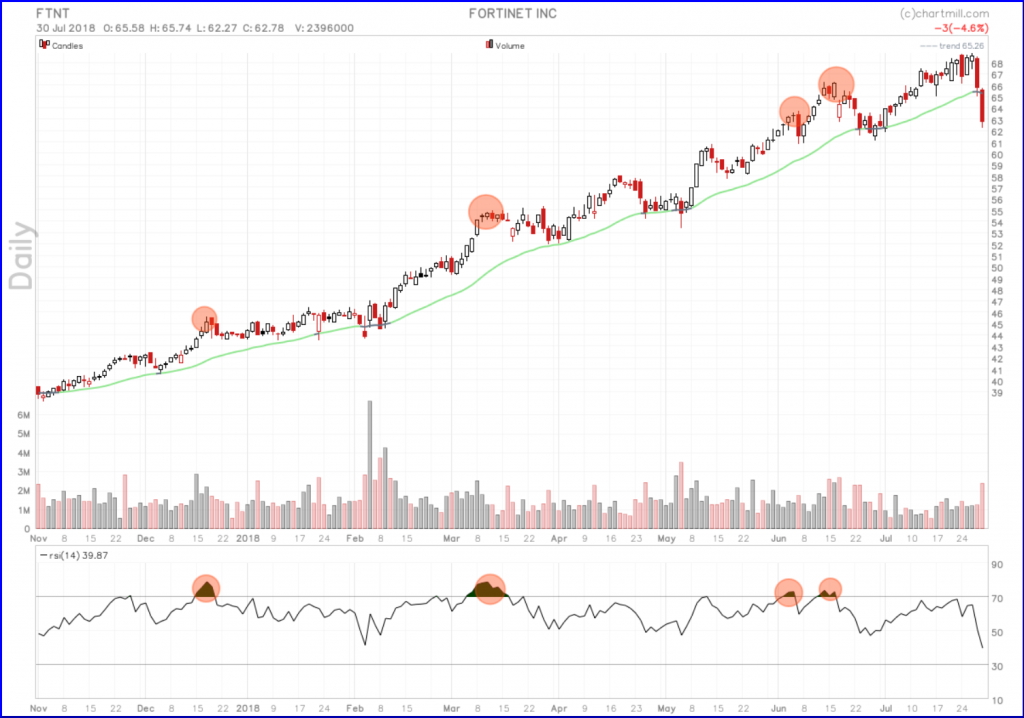
Uptrend:
The classic use of the RSI indicator in stocks with a strong uptrend will not be very successful. The upward trend of stock prices (green line) can be easily seen in the chart below.

RSI indicator and signaling from it
Labels: Order to build a Forex robot , Build a stock trading robot , Build a trading robot , Trader robot design , Free Forex Robot , Forex robot programming , Forex Expert Making Tutorial , Build a trading robot with Python , Download Forex Trading Robot , Buy Forex Trader Robot , Automated Forex Robot , Free stock trading robot , Learn how to build a Forex trading robot , Alpari trading robot , Forex robot for Android , MetaTrader robot design , MetaTrader robot programming , Forex robot design , Forex robot programming , Automated trading
As long as the trend is bullish, it is best to ignore the sell signals related to the RSI indicator. In such cases, you can choose your stocks when the price of the uptrend temporarily falls; Fortunately, the RSI indicator can be used for this. In the chart below, we have removed the sell signals and identified only when the RSI is below the 50 level.
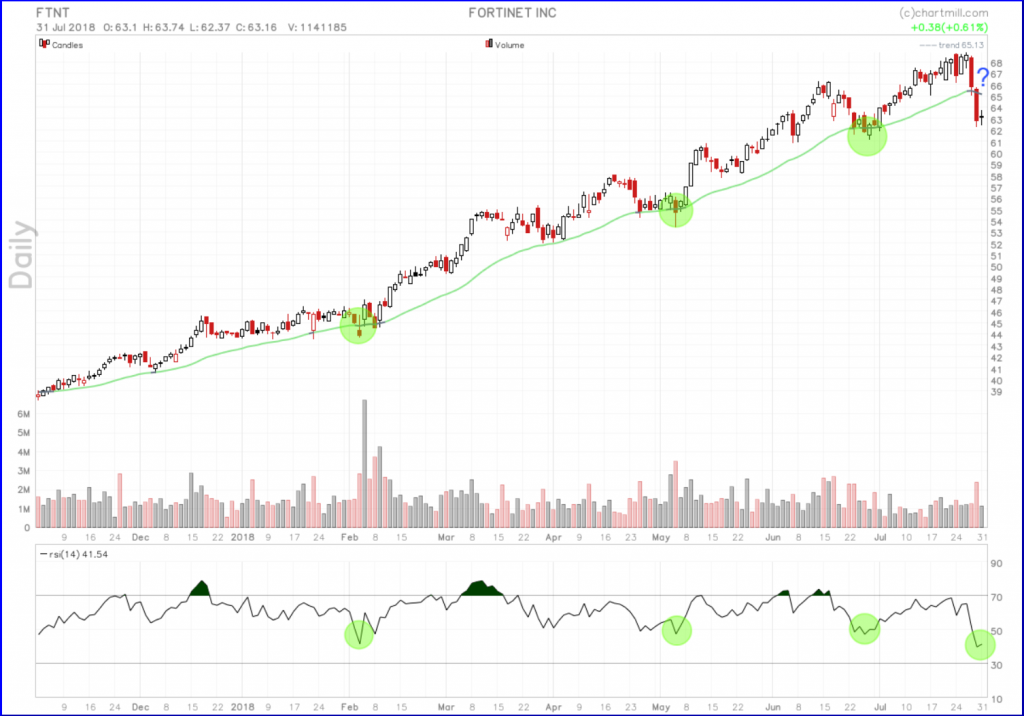
RSI indicator and signaling from it
When the RSI is in an uptrend below 50, buying stocks will ultimately bring a good profit to the trader and will allow him to increase trading opportunities in a stock.
-
downward trend :
If the stock price temporarily improves in a downtrend, you can use the RSI indicator to buy and sell those stocks. In the chart below, we have identified a downtrend (red line) that changes the price balance. The RSI indicator in this chart is sometimes neutral (gray) but never positive (green).
At these points in the chart, when the RSI rises above 50, traders will notice a sell signal. Of course, the second signal is wrong, which leads to very little damage. In addition, there are other signs in the chart that indicate a reversal of the price trend before the last RSI sell signal.
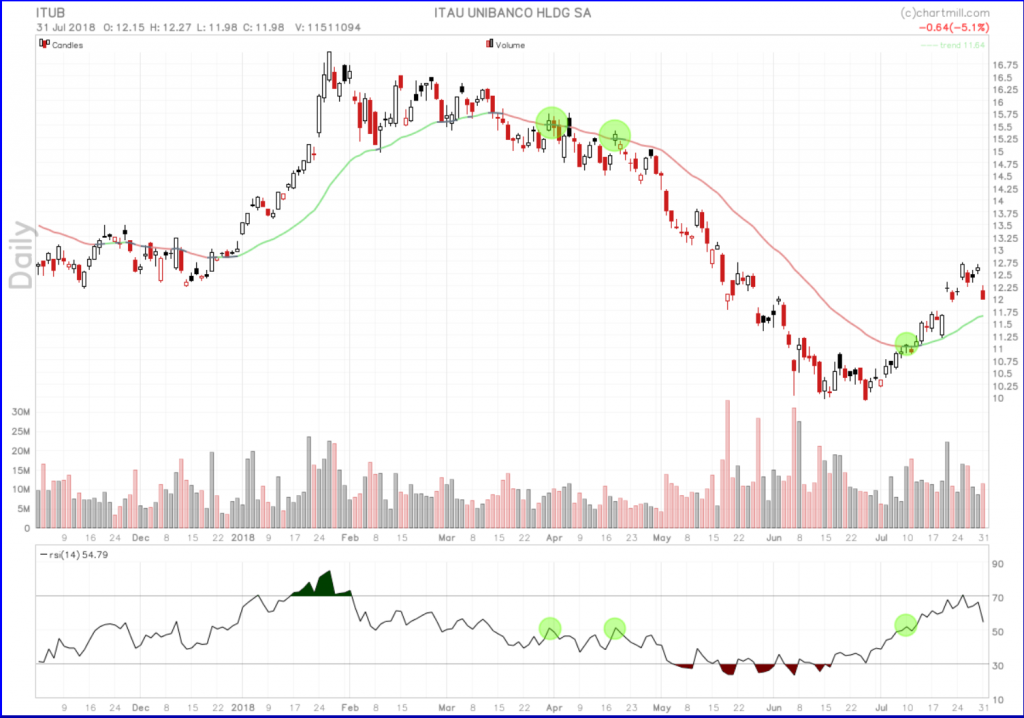
RSI indicator and signaling from it
Divergence of RSI signals
Divergence is another technique for using the RSI indicator. In fact, traders usually use the divergence between the RSI indicator and the stock price chart to identify turning points. This technique is actually one of the great ways to use the RSI indicator, which allows traders to identify trend changes.
What is RSI divergence?
In general, the shape and movement of the RSI chart is similar to the price chart. This means that if you convert your chart from candlestick to line chart, you can see floors and ceilings and similar movements in the RSI. Divergence means that there are differences between the price changes in the main chart and the movements of the RSI indicator. Divergence is also divided into positive and negative categories.
-
Positive divergence
Positive divergence occurs when the Lower Bottom price chart shows but the RSI indicator shows a higher price floor. This in fact indicates that the strength and speed of the downtrend is decreasing and as a result the price level will temporarily increase.
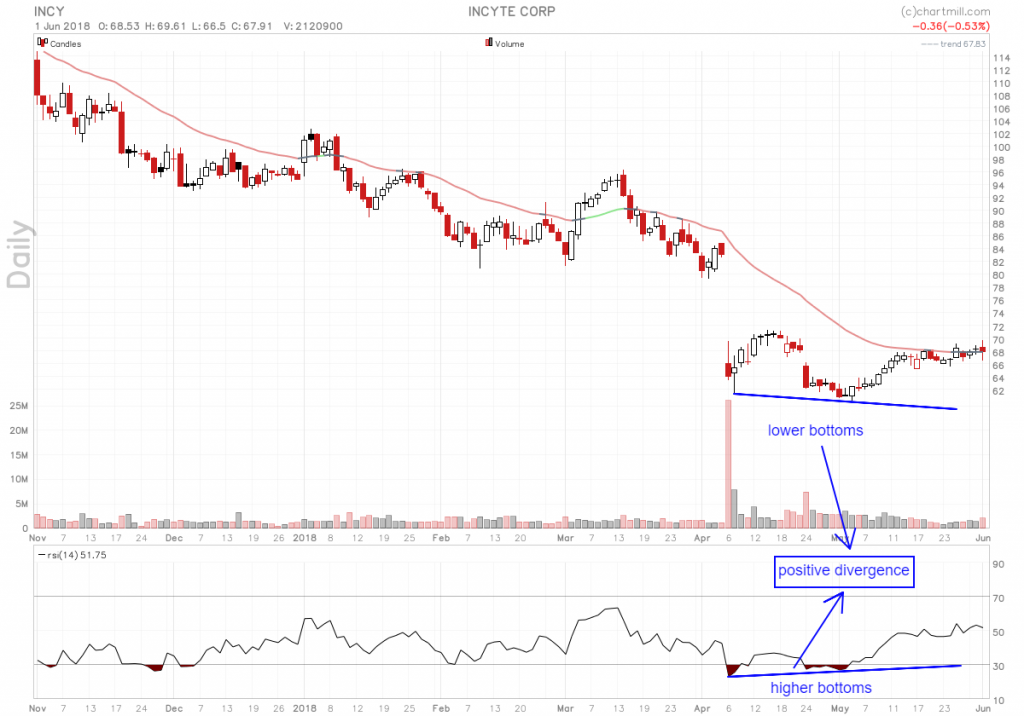
RSI indicator and signaling from it
As you can see in the picture above, after the creation of the second floor and the formation of this divergence, the downward trend in prices has become an upward trend.
-
Negative divergence
Negative divergence also occurs when the price floor is visible in the RSI indicator but the price chart continues to rise. This indicates that the acceleration and strength of the uptrend will decrease and there will be a possibility of (temporary) improvement in prices.

RSI indicator and signaling from it
The chart above shows that the price level has dropped very quickly after reaching the peak. Therefore, the RSI indicator has gone below 50. As this trend is increasing, so there are special conditions (RSI indicator less than 50 in the uptrend) that traders can rely on to re-enter the long-term sell position after the last two candlesticks.
Labels: Order to build a Forex robot , Build a stock trading robot , Build a trading robot , Trader robot design , Free Forex Robot , Forex robot programming , Forex Expert Making Tutorial , Build a trading robot with Python , Download Forex Trading Robot , Buy Forex Trader Robot , Automated Forex Robot , Free stock trading robot , Learn how to build a Forex trading robot , Alpari trading robot , Forex robot for Android , MetaTrader robot design , MetaTrader robot programming , Forex robot design , Forex robot programming , Automated trading


