
Be a beginner or a professional, if you are in the world of investing in financial markets such as the stock market, you are dealing with lines of support and resistance. So you have to know its types as well. Support and resistance lines in technical analysis are divided into two categories: static and dynamic. In this article, we examine the concept and differences of these types of surfaces and their application.
Labels: Order to build a Forex robot , Build a stock trading robot , Build a trading robot , Trader robot design , Free Forex Robot , Forex robot programming , Forex Expert Making Tutorial , Build a trading robot with Python , Download Forex Trading Robot , Buy Forex Trader Robot , Automated Forex Robot , Free stock trading robot , Learn how to build a Forex trading robot , Alpari trading robot , Forex robot for Android , MetaTrader robot design , MetaTrader robot programming , Forex robot design , Forex robot programming , Automated trading
What is static support and resistance?
Static support and resistance are levels whose price does not change under any circumstances. This amount of Rials is not dependent on time.
For example, we say that the resistance of the propulsion share is 140 Rials or 550 Rials. This means that whenever the price approaches this level, we will see support and resistance.
When the price is falling, we are faced with support, and when the prices rise and reach the desired level, we see the share approaching its resistance.
The simplest type of support and resistance levels is horizontal support and resistance, which we have already described.
Read more
What does the support and resistance of the share in technical analysis indicate?
In general, in technical analysis, the lower the slope of the support or resistance line, the stronger that level will be. According to this principle, it can be concluded that horizontal support and resistance levels with zero slope are the strongest type of these levels.
What is dynamic support and resistance?
Static and dynamic support and resistance
But dynamic support and resistance, unlike static support and resistance, is time dependent. That is, this amount changes at different intervals.
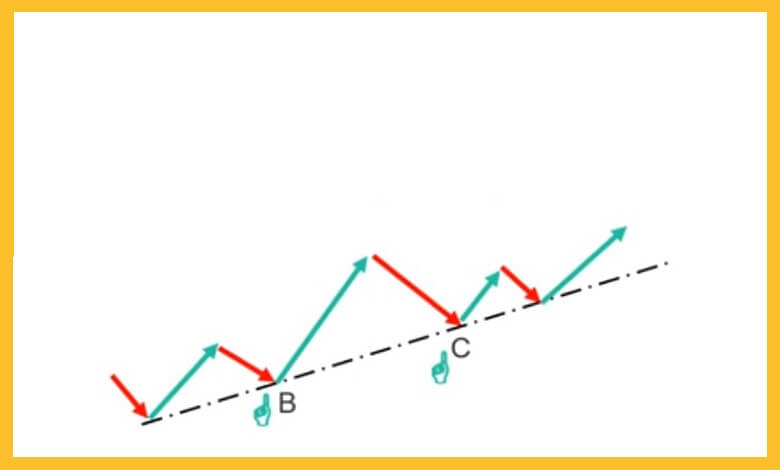
The trend line is an example of dynamic resistance and support that if we look at it in analytical charts, we will see its price change at different times. Dynamic lines have many applications in trend detection.
According to the principle mentioned in the previous section on the strength of support and resistance levels with respect to their slope, it can be concluded that dynamic lines, depending on their angle of inclination, are not as strong as static lines. Also checked.
For example, as shown in the image above, points B and C are both supported by the uptrend line. But the amount of support will vary depending on when the price collides with the trend line. The same is true of resistors.
Investigation of static and dynamic support and resistance on the diagram
Static and dynamic support and resistance
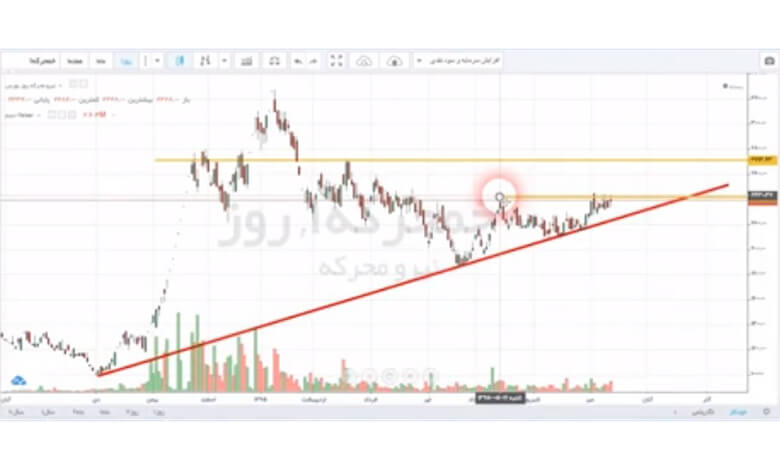
Now that we are familiar with the definitions of static and dynamic support and resistance, it is better to look at these items on a stock chart. In the image above, you can see the propulsion share diagram.
We have said that static support and resistance are related to specific prices that are fixed at all times and do not change. In this image, the yellow lines show the support lines and the static resistance of the stock. Here, the resistance of the share is equal to 241 Tomans, which the share could not cross.
This level can also be the support or resistance level of the share in the future.
You can also see the level of 271 Tomans in this chart, which has a relatively good number of encounters with it. Whenever (whether in the next month or in the next three months) the share price approaches this range (ie 271 Tomans), we should expect an increase in supply. Because this level shows static resistance.
But if you look at the stock trend line shown in red, you will see that the stock is improving. We will see support whenever the share approaches this line.
Here, the issue of time determines the amount of support in Rials. That is, it remains to be seen when the stock will hit the trend line. For example, if we see a collision on October 15, the support will be at 229 Tomans. Or if this clash happens on November 26, it shows the support of 234 Tomans. The same is true of trend line resistances.
Conclusion
Static and dynamic support and resistance are two important and basic concepts in stock analysis. In indicators and oscillators, we also encounter static and dynamic levels. The Rial amount of static support is always fixed. However, the amount of Rials in dynamic support is determined according to the time when the share chart hits the trend line.
It should be noted that static levels are the strongest state of support and resistance, and the higher the slope of support or resistance, the lower its strength.


