

To study how a currency pair moves, we need a way to examine the current and past behavior of its price. Charts were created for this purpose. In this article, we will get acquainted with different types of Forex charts and how to interpret them.
Labels: Order to build a Forex robot And Build a stock trading robot And Build a trading robot And Trader robot design And Free Forex Robot And Forex robot programming And Forex Expert Making Tutorial And Build a trading robot with Python And Download Forex Trading Robot And Buy Forex Trader Robot And Automated Forex Robot And Free stock trading robot And Learn how to build a Forex trading robot And Alpari trading robot And Forex robot for Android And MetaTrader robot design And MetaTrader robot programming And Forex robot design And Forex robot programming And Automated trading
A chart, or more specifically, a price chart, is the first tool that any trader using technical analysis needs to learn.
A chart is a visual representation of the price of a currency pair over a specified period of time.
The chart actually depicts the performance of trades that occur during a trading period (whether 5 minutes, or 4 hours, or daily and weekly).
Analytical charts can be made using price data for each financial asset (or currency pair) over a period of time.
Price changes are a series of mostly random events, so our job as a trader is to manage risk and assess probabilities, and this is where charts come in handy.
Charts are user-friendly because they make it much easier to understand and display price movements over time, which is something that is visually appealing.
Using charts, price movements, patterns and trends of a currency pair can be easily identified and analyzed.
In the chart, the y-axis (vertical axis) shows the price scale and the x-axis (horizontal axis) shows the time scale.
Prices are plotted on the x-axis from left to right.
The last price is drawn at the bottom right of the chart.
It is interesting to know that in ancient times, charts were drawn by hand!
Fortunately for us, Bill Gates and Steve Jobs were born and introduced computers to the public, so that diagrams can be drawn amazingly by software today.
What does the price chart represent?
The price chart depicts changes in supply and demand.
A chart brings together any trading pair or commodity at any given time.
The chart includes all the published news as well as the current expectations of traders from future news.
When the time comes and the reality is different from these expectations, prices change again.
“Future news” is now “published news” and with this new information, traders adjust their expectations based on future news. And this cycle repeats itself.
Charts combine all the activities of millions of market participants, whether human or robot.
It does not matter if the transaction is done by the actions of an exporter, foreign exchange intervention by a central bank, using the artificial intelligence of a fund or optional transactions of small traders, a diagram of all this information together and in a visual format Combines so that traders can easily analyze and study them.
These show the high value of charts in Forex.
Types of price charts
Let’s take a look at three of the most popular price charts:
- Linear graph
- Bar graph
- Japanese candlestick chart
Now, we will explain each of these Forex charts to you and tell you what you need to know about each of them.
Labels: Order to build a Forex robot , Build a stock trading robot , Build a trading robot , Trader robot design , Free Forex Robot , Forex robot programming , Forex Expert Making Tutorial , Build a trading robot with Python , Download Forex Trading Robot , Buy Forex Trader Robot , Automated Forex Robot , Free stock trading robot , Learn how to build a Forex trading robot , Alpari trading robot , Forex robot for Android , MetaTrader robot design , MetaTrader robot programming , Forex robot design , Forex robot programming , Automated trading
Linear graph
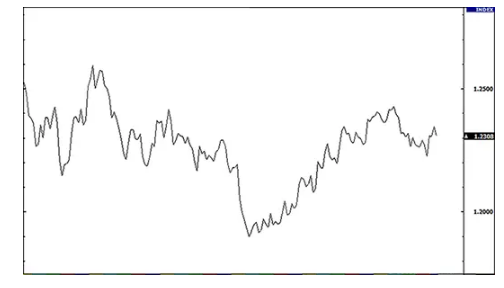
A simple line diagram draws a line from the closing price to the next closing price.
When the lines are connected, we can see the overall price movement of a currency pair over a period of time.
Understanding a bar chart is easy, but a bar chart may not give the trader much detail about price behavior within that time frame.
All you know is that the price closed at point X at the end of the period. You will not have the slightest clue as to what happened.
But the bar chart helps the trader to more easily see the trends and visually compare the closing price from one time period to another.
This type of chart is usually used to get an “overview” of price movements.
The bar chart also shows the trends better, which is actually the slope of the line.
Some traders consider the closing level to be more important than the opening level, floor fluctuation or price fluctuation ceiling. They only pay attention to the closing price and the price fluctuations are ignored in a trading session.
Here is an example of a EUR / USD line chart:
Types of charts in Forex and how to read them
Bar graph
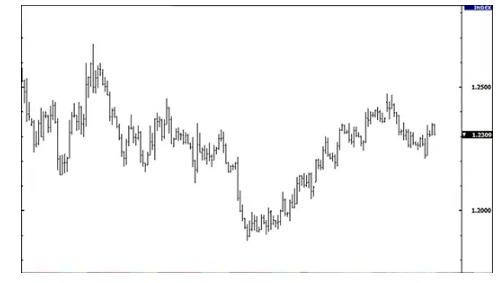
The bar chart is a bit more complicated. This chart shows the opening and closing prices as well as the price ceiling and floor.
The bar chart helps the trader to see the range of price fluctuations of each time period.
The bars may be large or small.
The vertical bar floor represents the lowest price traded for that time period, and the bar ceiling represents the highest price paid.
The vertical bar itself shows the range of transactions of that currency pair in general.
As price fluctuations increase, the bars get bigger. As price fluctuations decrease, the bars become smaller.
The fluctuation in rod size is due to the way each rod is made. The vertical height of the bar represents the interval between the price ceiling and the price floor of the bar.
The price bar also records the opening and closing prices of that time period with horizontal lines connected.
The horizontal appendage to the left of the bar is the opening price and the horizontal appendage to the right is the closing price.
Here is an example of a bar chart for EUR / USD:
Types of charts in Forex and how to read them
Note that in the lessons, we mean the word “bar” is a piece of data on a chart.
Each bar is a time interval that may be 1 hour, a day or a week, depending on your choice.
When using charts, pay attention to the time frame of that chart.
What is an OHLC chart?
Bar charts are also called “OHLC” charts because they indicate Open, High, Low and Close for that currency pair.
The main difference between a bar chart and a bar chart is that a bar chart can also show fluctuations.
Here is an example of a re-pricing bar:
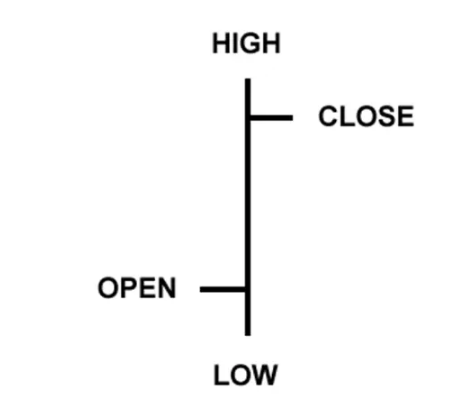
Types of charts in Forex and how to read them
OPEN: A small horizontal line on the left indicates the opening price.
High: The vertical line ceiling represents the highest price of the time interval.
LOW: The vertical line floor indicates the lowest price of the time period.
CLOSE: The small horizontal line to the right of the bar indicates the closing price.
Japanese candlestick charts
The Japanese candlestick chart is another type of bar chart.
Japanese candlestick charts show the same price information as bar charts, but in a more beautiful and graphic format.
Many traders like this type of chart because it is not only more beautiful, but also easier to read.
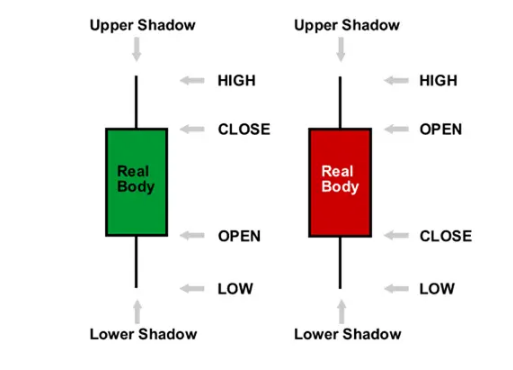
Japanese candlesticks continue to represent the upper slope to the lower slope using a vertical line.
However, in the Japanese candlestick chart, the body in the middle represents the range between the opening and closing prices.
Candles show the “body” and use different colors to make us feel better that the market is rising or falling.
It has long been the custom that if the body is filled or painted in the middle, the currency pair is closed less than the price opened.
In the example below, the “color filled” is black. For our “stuffed” bodies, above the body is the opening price and below the body is the closing price.
If the closing price is higher than the opening price, the body in the middle will be “white” or hollow or unfilled.

Types of charts in Forex and how to read them
Colored candle charts are more accessible
Here, we do not like to use traditional black and white candlesticks. Because they are not very attractive.
And because we spend so much time looking at charts, we find it easier to look at color charts.
A color TV is much better than a black and white TV, so why not have some candlelight?
We replaced green with white and red with black. This means that if the price closes above the open price, the candle is green.
If the price is lower than the opening price, the candle will turn red.
In the following lessons, you will see how using green and red candlesticks will help you see things on the chart much faster, such as uptrends and potential reversals.
Now, just remember that in Forex charts, we have used red and green candlesticks instead of black and white, and we will use these colors from now on.
See the candlesticks below! We know you like it!
Types of charts in Forex and how to read them
Here is an example of a Japanese candlestick chart for EUR / USD. Isn’t it beautiful?
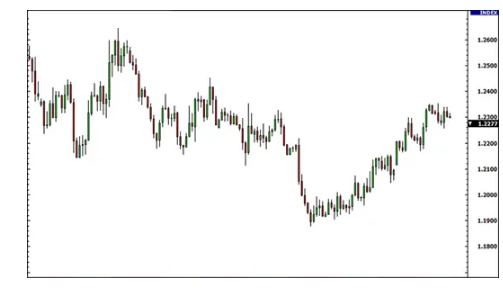
Types of charts in Forex and how to read them
The purpose of the Japanese candlestick chart is purely visual aid because it contains exactly the same information as a bar chart.
Benefits of Japanese Candle Charts
- Candlesticks are easy to interpret and are a good place for beginners to start studying Forex charts.
- Japanese candle charts are easy to use. Your eyes catch the information in the bars almost immediately. In addition, research shows that images help increase reading accuracy, so it may help the deal!
- Candles and candle patterns have fun names like “Shooting Star” that help you remember patterns.
- Candlesticks are good at identifying market milestones – reversals from uptrends or downtrends. We will talk more about this later.
There are many types of charts and one is not necessarily better than the other.
The data may be the same to make the chart, but the way the data is presented and interpreted is different.
Each chart has its own advantages and disadvantages. For technical analysis you can choose any type you like or use several charts at the same time. It all depends on your personal taste.
Now that you know why candlesticks are so attractive. It’s time to tell you that we have used Japanese candle charts in most places (if not everywhere) on this site.
Summarize the types of charts
There are various price charts that traders can use to analyze the Forex market.
Do not complicate matters by reading price charts.
Once you have your graphic tastes, look for the right and sufficient weight of information in the chart so that you can make good trading decisions. In other words, the information is not too much that your brain hangs and you can not make any decisions.
Finding the right combination is different for each trader. Therefore, it is important to familiarize yourself with the basics before using technical indicators (which we will discuss later).
Labels: Order to build a Forex robot , Build a stock trading robot , Build a trading robot , Trader robot design , Free Forex Robot , Forex robot programming , Forex Expert Making Tutorial , Build a trading robot with Python , Download Forex Trading Robot , Buy Forex Trader Robot , Automated Forex Robot , Free stock trading robot , Learn how to build a Forex trading robot , Alpari trading robot , Forex robot for Android , MetaTrader robot design , MetaTrader robot programming , Forex robot design , Forex robot programming , Automated trading


