
There are various charts in stock exchanges and capital markets that are used to identify and study price behavior in financial markets. These graphs are:
- Linear graph
- Candle chart
- Bar graph
Note: In these charts, the horizontal time axis and the vertical axis indicate the price.
Labels: Order to build a Forex robot , Build a stock trading robot , Build a trading robot , Trader robot design , Free Forex Robot , Forex robot programming , Forex Expert Making Tutorial , Build a trading robot with Python , Download Forex Trading Robot , Buy Forex Trader Robot , Automated Forex Robot , Free stock trading robot , Learn how to build a Forex trading robot , Alpari trading robot , Forex robot for Android , MetaTrader robot design , MetaTrader robot programming , Forex robot design , Forex robot programming , Automated trading
Before entering into the discussion of diagrams, one point should be noted:
For each share (currency pair, commodity, digital currency, gold, oil, etc.) traded during the day, four price points are obtained at the end of the day:
- Share opening price
- Share closing price
- Highest share price
- The lowest share price
For example, the transactions that have been done today on the shares of Isfahan Steel Company are as follows:
The first transaction on this share was done at a price of 1000 Tomans (opening price), then the highest price traded during the day was 1049 Tomans (highest price) and the lowest transaction price today was 998 Tomans (lowest price) and Finally, the last transaction was made at the price of 1011 Tomans (closing price).
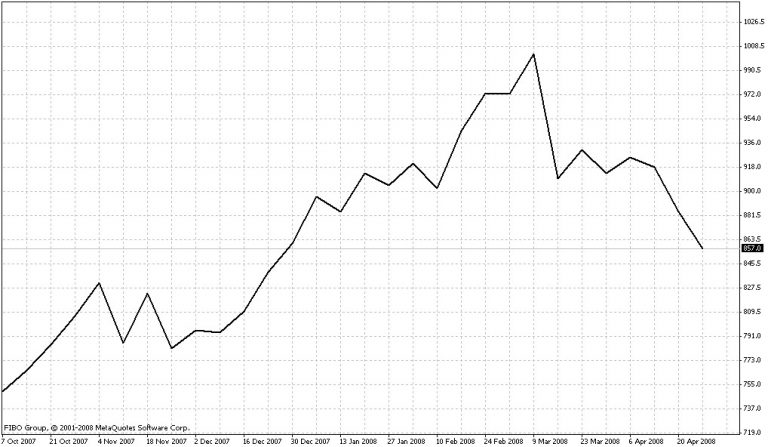
Linear graph (Linear graph )
The simplest way to show price trends and movements in financial markets is a line chart. This chart is obtained from the connection of the latest prices. The image below shows a line chart.
Types of charts in technical analysis
In a bar chart, the price of the last trades is connected by a line, and this chart is only to show price fluctuations , and is less used in technical analysis than the Japanese candlestick chart and bars.
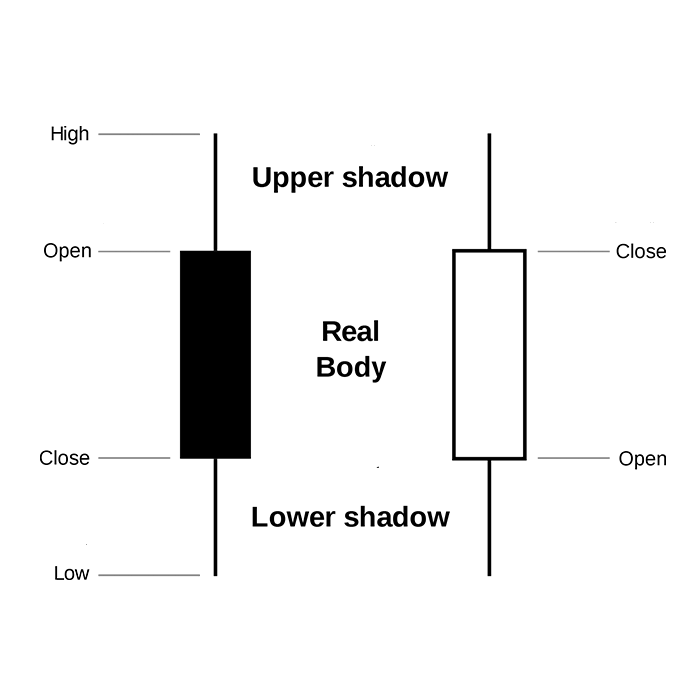
Candle chart or canldlestick
In the “Japanese candle” candlestick chart, all price information is clearly displayed on the chart. The candlestick chart is designed so that the positive and negative of the price can be easily distinguished. In this type of chart and so-called in each candle, four types of prices can be seen.
Types of charts in technical analysis
- Share opening price
- Share closing price
- Highest share price
- The lowest share price
Black, white candle candle in the figure above descending and ascending in fact, if the closing price is higher than the opening price, the price rose and candle upside and if the closing price is lower than the opening price of the candle downside is.
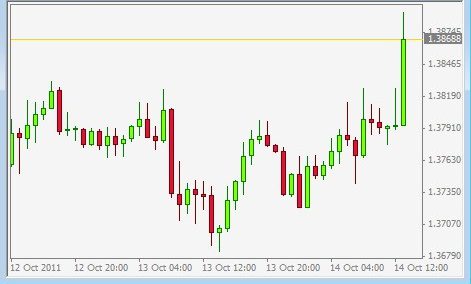
A candle chart is formed by placing candles or candles next to each other, which you can see in the figure below.
Types of charts in technical analysis
In the chart above, which is the EURUSD candlestick chart, each candle you see corresponds to one hour. In one hour, the open, closed, highest and lowest prices are in a candlestick. It is said that the time frame of this chart is one hour. There are several time frames, the most important of which are:
Daily, weekly, monthly, four-hour, one-hour, half-hour, 15-minute, 5-minute and timeframes
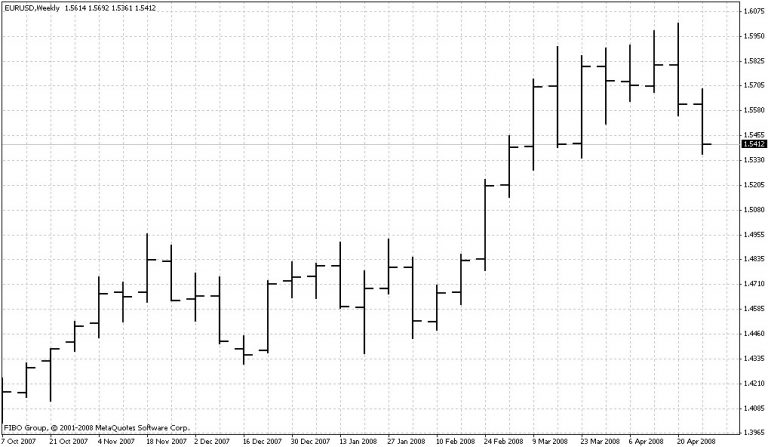
Bar graph
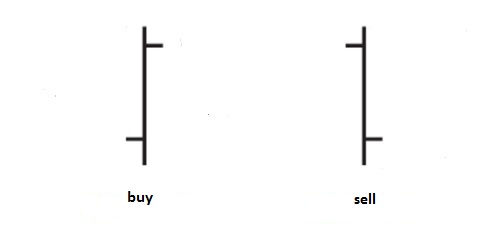
The bar chart is drawn as a vertical bar on the chart. Bar charts are similar to candlestick charts in that they have four prices, only the appearance of the two charts is different.
Types of charts in technical analysis
To the left of the bar is a small horizontal line that indicates the opening price , and to the right of it is a horizontal line that indicates the closing price or final price .
Types of charts in technical analysis
Is it possible to determine the future of the market and the next price movements by using these charts?
There are a few points:
1- Due to price fluctuations, the candlestick takes a special shape, each of which can be a kind of signal and in other words a trigger.
2- When two or more candlesticks are placed next to each other, as a result, they can form a special pattern. In this regard, there are important reversible and ongoing patterns that help us make decisions.
3- If Kendall can pass a certain price, it is another type of signal for the analyst. Here, the specific price refers to the support and resistance range that the price has reacted to in the past.
4- History repeats itself; When candlesticks make a certain move several times, it is expected to happen again in the future.
Labels: Order to build a Forex robot , Build a stock trading robot , Build a trading robot , Trader robot design , Free Forex Robot , Forex robot programming , Forex Expert Making Tutorial , Build a trading robot with Python , Download Forex Trading Robot , Buy Forex Trader Robot , Automated Forex Robot , Free stock trading robot , Learn how to build a Forex trading robot , Alpari trading robot , Forex robot for Android , MetaTrader robot design , MetaTrader robot programming , Forex robot design , Forex robot programming , Automated trading


