
Support and resistance lines are among the most fundamental topics in technical analysis . They are psychological points and the meeting place of buyers and sellers. These are the lowest and highest possible levels for stock or currency changes.
In fact, these lines are formed due to the highest and lowest price limits, and the formed lines can be vertical, descending or ascending. Support and resistance lines are created as a result of confrontation between buyers and sellers.
Labels: Order to build a Forex robot , Build a stock trading robot , Build a trading robot , Trader robot design , Free Forex Robot , Forex robot programming , Forex Expert Making Tutorial , Build a trading robot with Python , Download Forex Trading Robot , Buy Forex Trader Robot , Automated Forex Robot , Free stock trading robot , Learn how to build a Forex trading robot , Alpari trading robot , Forex robot for Android , MetaTrader robot design , MetaTrader robot programming , Forex robot design , Forex robot programming , Automated trading
These are the points where some investors make a profit, others strengthen their position in these points and trade in the lines of resistance or support.
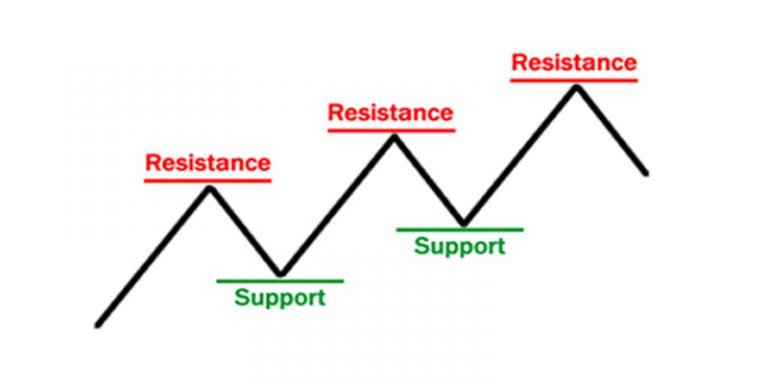
Types of support and resistance in technical analysis
What do support or resistance lines mean in technical analysis?
Learning support and resistance lines is one of the most important factors in stock market education . Resistance is a level of prices and reflects the dominance of sellers to buyers frequently. This level prevents prices from rising because there are more sellers than buyers. As a result of resistance, we will see a downward trend (Bearish Price).
Support is the level of prices that buyers have beaten sellers several times in the past. Support prevents price increases because there are more buyers than sellers. This event will cause an uptrend (Bullish Price).
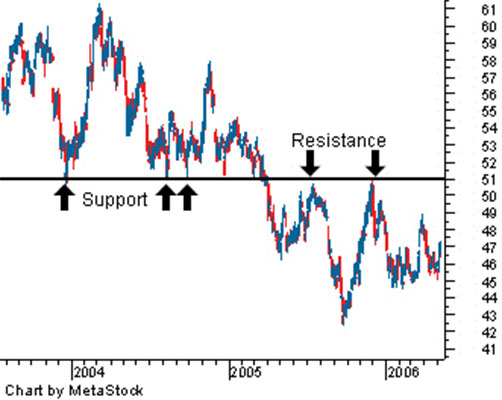
Support and resistance lines are formed at least by the contact of two points with the price of the chart. Otherwise, the relevant point is considered as the highest and lowest area of the trend. The third point of contact indicates the greater credibility of the support or resistance line.

Types of support and resistance in technical analysis
Different types of support and resistance lines
Identifying lines of support and resistance is very important in trading the stock market and foreign exchange. Most traders check these lines every day and through them they can analyze the price level. To avoid losses in transactions, it is necessary to have full knowledge of resistance and support before buying and selling.
Support and resistance lines can be of different types. Here we look at different shapes.
This article may be useful to you: What is technical analysis?
Horizontal support line and horizontal resistance line
The highest points (resistance lines) and the lowest points (support lines) are on the same level. That is, by connecting the highest points, a horizontal resistance line is created, and thus by connecting the lowest points together, a horizontal support line is formed. Note the following figure. The top line is the resistance line and the bottom line is the support line .
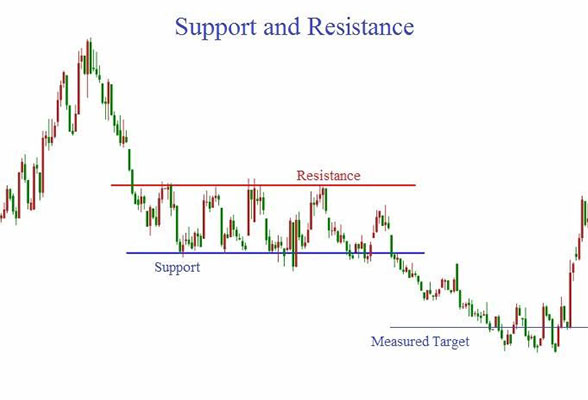
Types of support and resistance in technical analysis
Ascending support and resistance lines
Ascending support and resistance lines are obtained by extending the Low and Higher Low points and the High and Higher High points. Look at the picture below. If we connect the upper and highest points of the trend, an ascending resistance line is created. Conversely, if we connect and extend the lower and lower points of the trend, an ascending support line is formed. Resistance means resistance and Support means support (HH = Higher High and HL = Higher Low.)
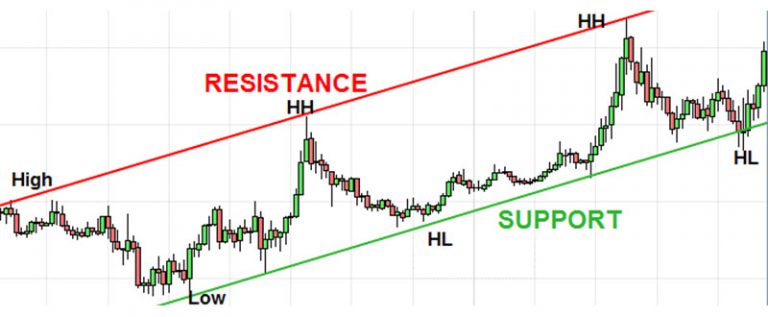
Types of support and resistance in technical analysis
Downward support and resistance lines
The support line and the downtrend are created by connecting the Low and Lower Low points, as well as by connecting the High and Lower High points, respectively.
The following figure shows the upper downtrend, resistance and the downtrend as support. The descending support line is created by connecting the Low and Lower Low points. But the descending resistance line is formed by connecting the High and Lower High points. (LH stands for Lower High and LL stands for Lower Low)
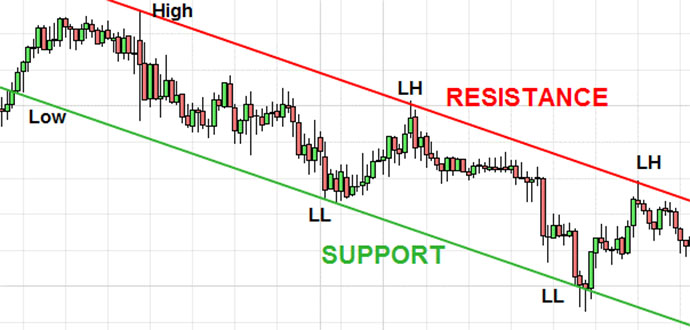
Types of support and resistance in technical analysis
The rules needed to understand the lines of resistance and support
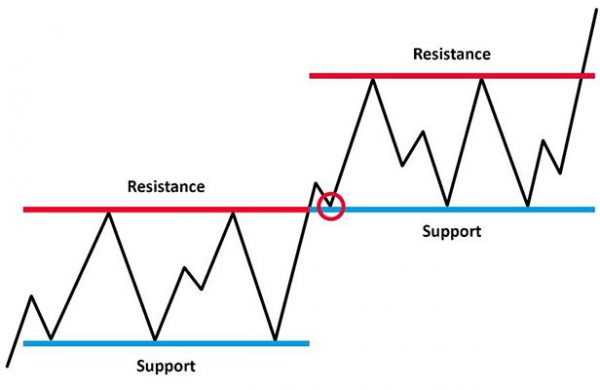
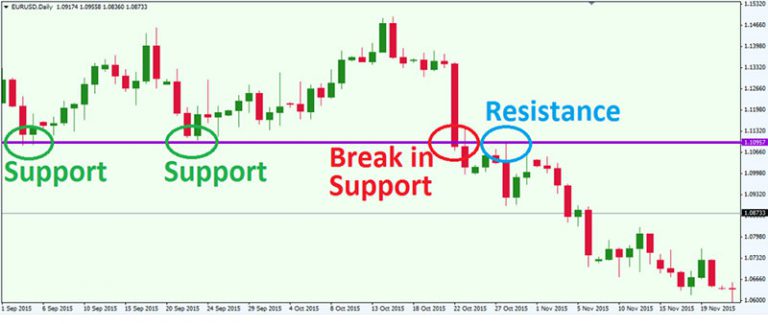
Understanding and applying the rules of support and resistance lines in trading is one of the important points of success in the stock market. The lines of resistance and support are always broken once. When a resistance line breaks, it becomes support in the price chart.
In other words, when the support line breaks, it becomes a resistance line. Converting resistance to support is called R to S and converting support to resistance is called S to R. The word S stands for Support. And the word R stands for Resistance. The following figures show the conversion of support to resistance and resistance to support.
Types of support and resistance in technical analysis
Convert S to R
Types of support and resistance in technical analysis
Convert R to S
Can support and resistance lines have a psychological reason?
Types of support and resistance in technical analysis
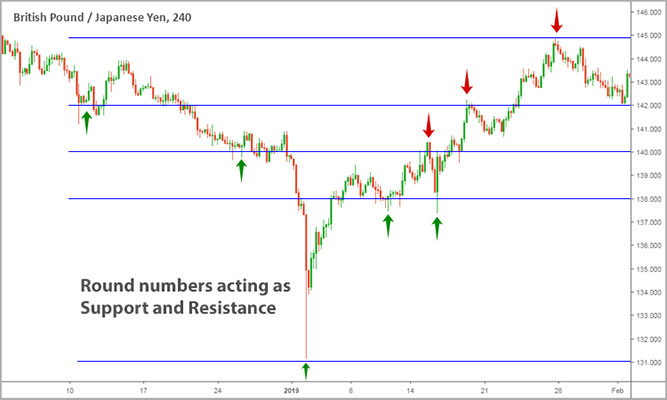
Support and resistance lines at some levels can have psychological reasons. According to psychology, trend numbers are sometimes used as support and resistance points.
These points are the position of a large number of traders for buying or selling. Examples of the importance of trend numbers can be found in various financial markets. The numbers 1.20, 1.25 and 1.30 in the pound / dollar currency pair can play an important role in determining the price level.
In the stock market, if the stock price reaches $ 10, $ 50 and $ 100 or any other trend, keep in mind that these prices can act as support and resistance levels in the market.
The more contact levels, the more likely to fail
Types of support and resistance in technical analysis
The more the prices collide with the support and resistance lines , the more likely it is that the support or resistance line will break. The greater number of calls indicates the willingness of buyers and sellers to break the line of support or resistance.
In a support line, the power of buyers gradually decreases and with the break of the support line, prices fall. In the resistance line, the power of sellers gradually decreases and with the break of the resistance line, prices increase. In contact with the fourth point, the probability of interruption is very high. It is very rare for resistance or support lines to appear with five points of contact.
Labels: Order to build a Forex robot And Build a stock trading robot And Build a trading robot And Trader robot design And Free Forex Robot And Forex robot programming And Forex Expert Making Tutorial And Build a trading robot with Python And Download Forex Trading Robot And Buy Forex Trader Robot And Automated Forex Robot And Free stock trading robot And Learn how to build a Forex trading robot And Alpari trading robot And Forex robot for Android And MetaTrader robot design And MetaTrader robot programming And Forex robot design And Forex robot programming And Automated trading
Support and resistance area
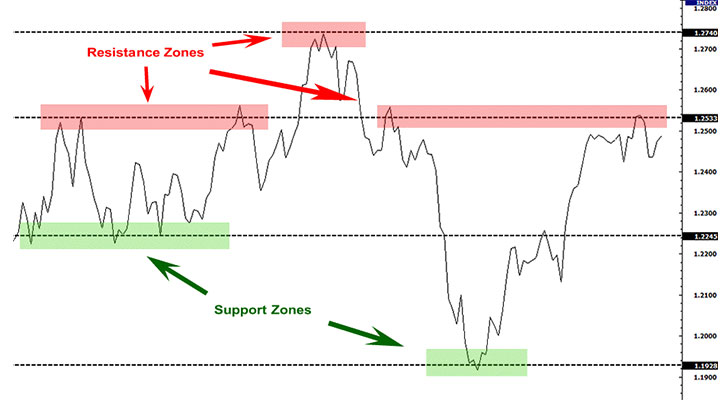
Types of support and resistance in technical analysis
Support and resistance should not be just at one exact point in prices. It is possible that sometimes the prices go beyond a level and the candlestick closes somewhere above or below the desired level. For this reason, it is recommended to consider a part of the upper and lower candlesticks as a resistance and support area.
Strong and weak support and resistance

Types of support and resistance in technical analysis
Not all lines of support and resistance have the same value. Some resistance and support lines are strong and some are weak and small.
A line of resistance or support that has only one point of contact and has no psychological background is considered as a weak and small line of support and resistance. The line of resistance and strong support has been created by the collision of several points of contact in the past. When we talk about strong resistance and support lines, we mean contact points in time units more than your current trade.
The last word
The use of support and resistance lines in trading is very useful and efficient. They help you open a position and set future prices. When one line of resistance or resistance breaks, the target is the next line of support and resistance. In general, a trader uses support lines to buy and resistance lines to sell. Break points can also be traded.
Labels: Order to build a Forex robot , Build a stock trading robot , Build a trading robot , Trader robot design , Free Forex Robot , Forex robot programming , Forex Expert Making Tutorial , Build a trading robot with Python , Download Forex Trading Robot , Buy Forex Trader Robot , Automated Forex Robot , Free stock trading robot , Learn how to build a Forex trading robot , Alpari trading robot , Forex robot for Android , MetaTrader robot design , MetaTrader robot programming , Forex robot design , Forex robot programming , Automated trading


