Heiken Ashi?
You are probably familiar with these three popular types of charts: line charts, bar charts, and Japanese candlestick charts.
But there is another chart you should know about that uses a completely different technique to show price movements.
Heiken Ashi
Labels: Order to build a Forex robot And Build a stock trading robot And Build a trading robot And Trader robot design And Free Forex Robot And Forex robot programming And Forex Expert Making Tutorial And Build a trading robot with Python And Download Forex Trading Robot And Buy Forex Trader Robot And Automated Forex Robot And Free stock trading robot And Learn how to build a Forex trading robot And Alpari trading robot And Forex robot for Android And MetaTrader robot design And MetaTrader robot programming And Forex robot design And Forex robot programming And Automated trading
Yes we are just talking about charts! We are not talking about anything else!
Heiken Ashi, also known as Heiken Ashi, is a charting technique used to display prices, which at first glance resembles a conventional Japanese candlestick chart.
The difference is in how the candlesticks are calculated and drawn and placed on the chart.
Japanese candlesticks are very useful for finding entry points because they indicate possible reversals of the trend (such as the Shotink Star) or breakouts (such as an ascending Marobozo closing above the resistance level).
But what about when you open a trade?
Using the Heiken Ashi technique on the price chart can help you decide whether to keep the trade open or exit the market.
Traders want to know when to stay open and take advantage of the current strong trend and when to exit the market with a weak trend. They can make Japanese candle charts more readable by using Heiken Ashi diagrams.
Basically, the Heiken Ashi chart is a modified Japanese candlestick chart technique that resets the way prices are displayed so that traders on the trend can make a more confident decision when deciding whether to hold or close a trade.
Some traders, usually long-term traders, use Heiken Ashi charts as an alternative to Japanese candlestick charts.
Other traders use them alongside Japanese candlestick charts, sometimes using one and sometimes the other.
What is a Heiken Ashi Chart?
In Japanese, Heiken Ashi means “average” and Ashi means “speed”. So together, Heiken Ashi means “average price speed.”
Heiken Ashi is a kind of graphing technique using a candle that is used to help filter out noise or graphic error signals.
The Heiken Ashi technique was invented hundreds of years ago by Monet Hisa Homa, a rice trader from Sakata, Japan, who is called the father of the Japanese candlestick chart.
Homa realized that by tracking price movements in the rice market, he could really “see” and use the psychological behavior of other market participants.
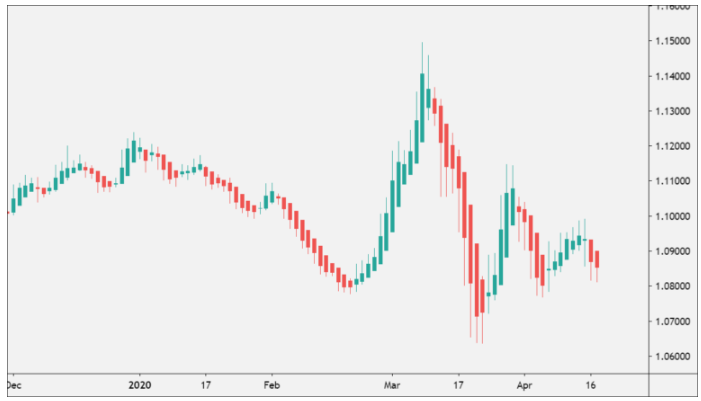
Here is an example of a Heiken Ashi chart:

What is Heiken Ashi?
Labels: Order to build a Forex robot And Build a stock trading robot And Build a trading robot And Trader robot design And Free Forex Robot And Forex robot programming And Forex Expert Making Tutorial And Build a trading robot with Python And Download Forex Trading Robot And Buy Forex Trader Robot And Automated Forex Robot And Free stock trading robot And Learn how to build a Forex trading robot And Alpari trading robot And Forex robot for Android And MetaTrader robot design And MetaTrader robot programming And Forex robot design And Forex robot programming And Automated trading


