When trading in the financial markets, it is important to know the right positions to enter or exit a stock. Breakout line breaks can also indicate the right conditions to enter or exit a stock, which is why a trader should be able to identify the standard breakout of that line.
Labels: Order to build a Forex robot , Build a stock trading robot , Build a trading robot , Trader robot design , Free Forex Robot , Forex robot programming , Forex Expert Making Tutorial , Build a trading robot with Python , Download Forex Trading Robot , Buy Forex Trader Robot , Automated Forex Robot , Free stock trading robot , Learn how to build a Forex trading robot , Alpari trading robot , Forex robot for Android , MetaTrader robot design , MetaTrader robot programming , Forex robot design , Forex robot programming , Automated trading
Standard or valid trend line failure can occur in both uptrends and downtrends. But to correctly diagnose a trend line failure, we must be familiar with the valid failure conditions so that we can determine whether or not a breakout occurs.
Standard trend line failure conditions
The standard failure of the trend line has five main conditions:
1- Price influx to the leading level
When we see prices approaching that level on a trend line, we expect support or resistance depending on the direction of that trend line. We have to be careful in the transactions made in the mentioned share and see which of the supply and demand weighs heavily. Therefore, to diagnose failure, it is important to examine the amount of demand or supply in the stock. In this situation, either buyers attack to buy or sellers to sell. This can be understood by examining orders and transactions within the system.
2- More slope of the current failure wave than the previous wave
If the slope of the previous price collision with the trend lines is lower than the current slope of the collision, the credit for failure is greater. That is, the last collision and the last move towards the trend line have a greater slope than the previous collision and move.
An indicator called “Momentum” is used to determine the slope or acceleration of the price. The higher the momentum line, the higher the acceleration or power of the candlestick, and the larger the candlesticks.
3- High volume of transactions
Having a high volume of transactions is very important and significant. Usually in breaking the standard trend line, we see an increase in trading volume. Because in order to break the trend lines, one of the two cases of support or resistance must be broken, which requires a high volume of trades.
Sometimes the trend line breaks and the price candle closes above the trend line; But the next candlestick goes down and breaks this trend line again downwards. This is called a fakeout. Trading volume is one of the most important indicators for determining the validity of a breakout.
4- Failure of support or resistance with a strong candlestick
For a valid break of the downtrend line, an uptrend should be created that closes above the trend line. This candlestick may have a short shadow with a large body, but it may have a medium body with a long shadow. But the important thing here is that the candlestick must be closed above the trend line, so that we can receive a buy signal.
To break the uptrend line, a descending candle must be created that closes below the trend line.
5- Existence of pullback
When trend line breaks occur, we see a movement called pullback . Polbeck, in fact, examines the role of lines of support and resistance. We know that these lines change after failure. When the standard break of the uptrend line occurs, this uptrend has a supportive role. After a break, the price moves closer to that level to see if the support has turned into resistance. The opposite is also true. It means when the downtrend line is broken. In this situation, we expect that the pullback to the mentioned level will cause price support and we will see the beginning of upward movements in the share.
Check the valid failure of the uptrend line

What is standard failure?
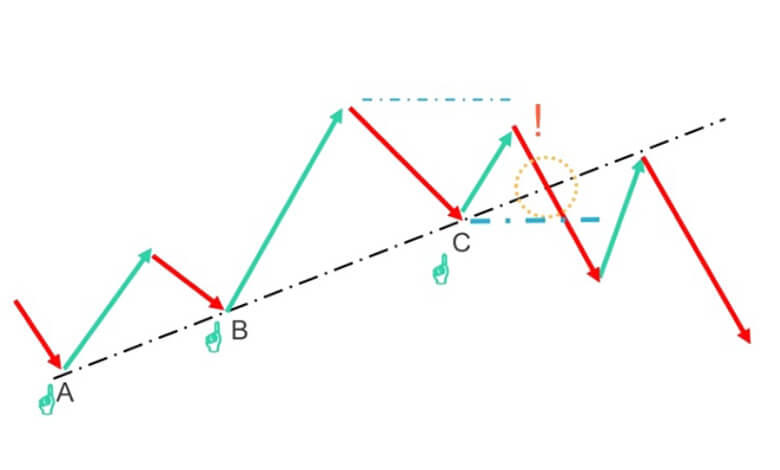
Given the valid breakout conditions of the trend line mentioned above, it is best to look at a few real-life examples. As you can see, when the uptrend occurs, we will see the trend line pass through points B, A and C.
When we draw a horizontal line on the highest ceiling created and determine its alignment, we notice that the new roof is formed lower than the previous roof. This is the first alarm that can alert us to the process of breaking the trend line. As soon as we see this happen, we must prepare ourselves. Because there is a possibility that the trend line will be broken.
If we look at the red arrow marked with an exclamation mark in the image, we notice that its slope is much higher than the previous flash. It is clear that the slope of the new flash is steeper. The collision distance of these two red arrows is also very close compared to the collision distance of the previous arrows. If you remember, this was another condition for breaking the standard trend line.
From point C, which we consider as the last pivot, we draw a horizontal alignment. In this way we find that the break of the trend line occurred in such a way that the price reaches a horizontal level such as C after coming down from the trend line. Then it will move up again. In this situation, we will no longer see failure and the price will be above the trend line again. Thus, we see here that the price will have an upward trend.
tip
The implication is that in order to fail, we have to wait for the price to move out of the orange circle and move down. In this way, failure will be definite. That is, after the failure of the standard trend line, we will see an upward and pullback movement. This pullback can be on the trend line or at the same horizontal level C. After these steps, the stock will start to fall. Because the trend that was examined here has been upward and broken and has now come to an end.
Check the standard failure of the downtrend line

What is standard failure?
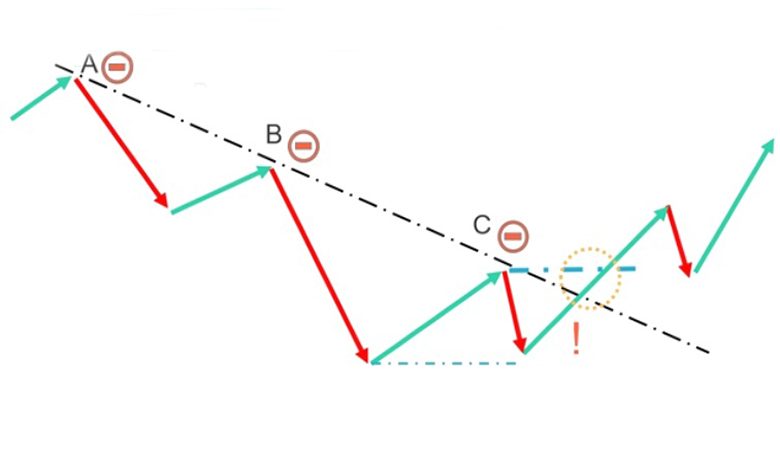
In the downtrends, the same developments as mentioned above occurred, but in the opposite direction. That is, if we have a downtrend line that passes through points B, A, and C, the first warning range is where the new floor is created, above the previous floor. In such a situation, there is a possibility of a valid failure of the downtrend line.
In such cases, we must concentrate. As shown in the image, the ascending arrow slope at point C is greater than the previous flash slope. The distance between the last two green arrows is shorter than the previous arrows, which can also be considered as a second sign of failure.
Next we will see the passage of the horizontal plane that passes through the point C. The next step is to cross the area of the orange circle and the pullback to a plane equal to C. Eventually an uptrend will begin and we will see the formation of a new trend that may take some time.
Conclusion
Breaking the trend line can be a sign of the right time to buy or sell a stock. What is important in this regard is to recognize the validity of the fractures.
There are five main factors in validating trend breaks. If, according to these factors, the failure we are considering is valid, we can consider it as a signal to buy or sell. Paying attention to such cases can create low-risk and high-yield opportunities for investment.
Labels: Order to build a Forex robot , Build a stock trading robot , Build a trading robot , Trader robot design , Free Forex Robot , Forex robot programming , Forex Expert Making Tutorial , Build a trading robot with Python , Download Forex Trading Robot , Buy Forex Trader Robot , Automated Forex Robot , Free stock trading robot , Learn how to build a Forex trading robot , Alpari trading robot , Forex robot for Android , MetaTrader robot design , MetaTrader robot programming , Forex robot design , Forex robot programming , Automated trading


