
One of the best and easiest ways to trade quickly and easily in the Forex financial market is the zigzag indicator strategy. The zigzag indicator reduces the effect of random price fluctuations and is used to help identify the main price trend and trend changes. The zigzag pattern gives you an unadulterated and pure view of the market situation where you can see and take advantage of price swings in different timeframes. With the zigzag indicator, you can swing, scalp and analyze and trade in long-term timeframes.
Labels: Order to build a Forex robot , Build a stock trading robot , Build a trading robot , Trader robot design , Free Forex Robot , Forex robot programming , Forex Expert Making Tutorial , Build a trading robot with Python , Download Forex Trading Robot , Buy Forex Trader Robot , Automated Forex Robot , Free stock trading robot , Learn how to build a Forex trading robot , Alpari trading robot , Forex robot for Android , MetaTrader robot design , MetaTrader robot programming , Forex robot design , Forex robot programming , Automated trading
As you know better, markets do not go up and down in direct movements. Anyone who looks at any chart for just a few seconds will notice. In financial markets such as the stock market and Forex, we are always faced with volatile movements, Elliott waves and peaks and valleys. With the help of the zigzag pattern, we can find potential price areas in these waves.
How does the zigzag indicator help us?
This index reduces the extra noises in the chart and price chart and shows the basic trends more and better.
The zigzag index performs best in markets with strong trends.
Familiarity with the Zig Zag indicator
This indicator appears on the chart whenever prices change by a certain percentage above a pre-selected amount. Then straight lines are drawn and these points are connected.
This index is used to help identify price trends. This indicator eliminates random price fluctuations and tries to show the real and main changes of the trend. The main lines appear only when the difference between the price difference at the top and bottom of a swing is more than the specified percentage – often 5%. By filtering out minor price changes, this indicator makes it easier to identify trends at all time intervals.
The zigzag index is often used in conjunction with Elliott wave theory to determine the position of each wave in the overall cycle. Traders can test different results with percentage adjustments to see what works best for them. For example, a 4% setting may indicate waves more clearly than a 5% setting. Stocks are different from Forex and also have their own patterns, so traders will most likely need to optimize the Zig Zag index percentage accordingly.
Although the zigzag index does not predict future trends, it helps identify areas of support and potential resistance between the highs and lows of previous fluctuations. Zigzag lines can also show inverted patterns in the price chart. Traders can use common technical analysis indicators such as relative strength index (RSI) and oscillators to confirm a buy or sell when changing the Zig Zag direction.
The zigzag indicator is a very useful technical tool, of course, if you want to trade with trading patterns such as Elliott waves, Fibonacci or any other instrument that deals with waves in any way.
According to most analysts, this indicator is in the list of top 5 indicators of MetaTrader, which, if used properly, will help the trader in trading. In the continuation of this article, we want to deal with it in more detail and by mentioning an example. So stay tuned for the rest of this article.
How to work with zigzag strategy?
As we have said, the zigzag is a technical tool that identifies the top and bottom swings of the market. This will help you to find them more accurately. In fact, the main purpose of this tool is to filter out the misleading noise and fluctuations of the market.
The zigzag indicator in Metatrader is an essential tool for traders to use to assess the likelihood of a trend change in an asset, currency or stock. When analyzed and used with resistance, support, and ،, it helps you understand when the market has actively reversed the trend or hypothetically broken one of the previous levels. This helps to eliminate many of the noisy situations that are usually present in a process and focuses only on the overall direction of the movement.
This index does this using a certain percentage of price movement. There are several theories that you should use, and that’s your responsibility as a trader. However, the main idea is that if the trend of a certain percentage does not change, this trend has not changed at all. It should be noted that the default setting is 5.
When you apply a zigzag marker on the chart, it removes a lot of noise in long-term movements, so it is much more effective in long-term charts than in short-term charts. This chart is shown with a simple line on the chart that looks almost like a trend line, but does not look up and down a specific set of candles. This simply illustrates the process.
You can also read this link for a more detailed study.
Eliminating deceptive fluctuations allows you to see a larger and clearer picture of price movements. Take a look at the image below.
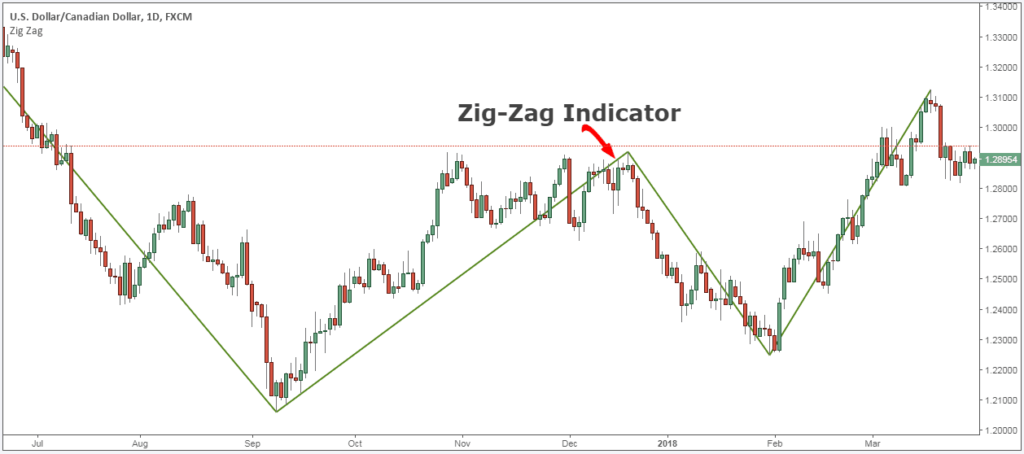
Zigzag indicator strategy for Forex trading
The parameters of the zigzag indicator should cover a sufficient number of market candles to examine so that the waves you see in the chart are more accurate.
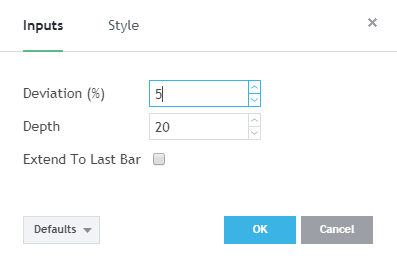
- Depth – This parameter actually specifies the number of candlesticks that the indicator goes back on the chart to draw its waves.
- Deviation – This parameter, which is specified as a percentage, tells the indicator how much change in price direction is needed to form a new wave.
There are no great settings for this tool, but the important thing is that you spend enough time in the market and play with these parameters to get the best setting for each of the charts you trade.
When playing with these parameters, be sure to pay attention to the following points:
- The symmetry or price order should be beautifully visible and the waves should be as harmonious as possible, almost as we see in the AB = CD pattern.
- The depth should be adequate so that the space between the top and bottom swings can be well cleaned.
Proposed trading instructions with zigzag indicator
The ZigZag trading strategy presented below requires the use of a specific index. The Fibonacci additive pattern will be used to confirm the ABCD pattern. It will also be used for business management. Now, before we go any further, we always recommend getting a piece of paper and a pen. Write down the rules of this entry method. For this article, we want to look at a buying deal.
Step 1: Adjust the ZigZag indicator settings to a depth of 20 and a deflection of 5.
First of all, we want to make sure that the ZigZag tool only shows the highlights and fluctuations in the market. To do this, we must use at least 20 cycles for depth and 5% deviation to accurately display market fluctuations.
Zigzag indicator strategy for Forex trading
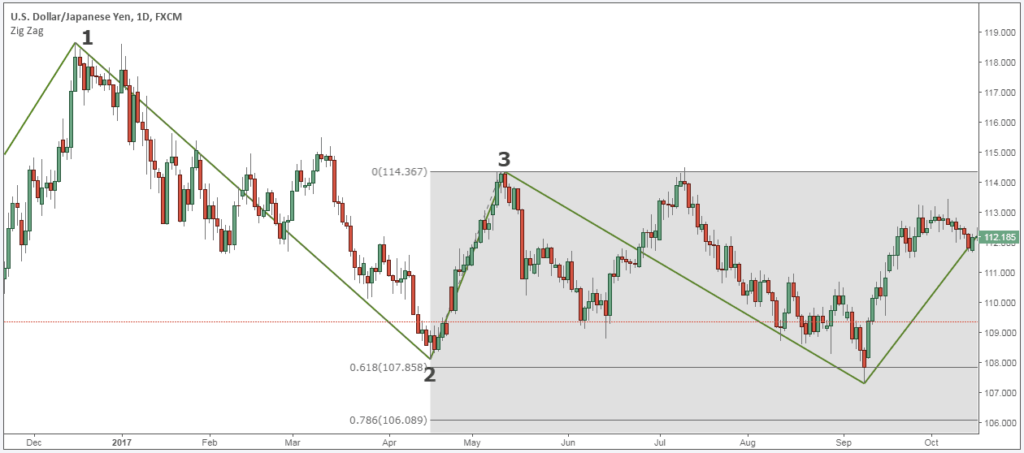
Step 2: After establishing the first two swing waves, draw the Fibonacci extension
To draw the Fibonacci line, we need three reference points. As soon as the first two waves of the zigzag pattern develop, we present three levels of oscillation. We intend to use them to draw Fibonacci extension levels.
Zigzag indicator strategy for Forex trading
The reason for using Fibo extension surfaces is to predict where the last wave of the Zig Zag pattern will form.
The zigzag indicator strategy shows low volatility just to secure and rely on its trades alone in this index. This is the main reason for using different trading tactics. These tactics are used to predict where the zigzag pattern is most likely to end.
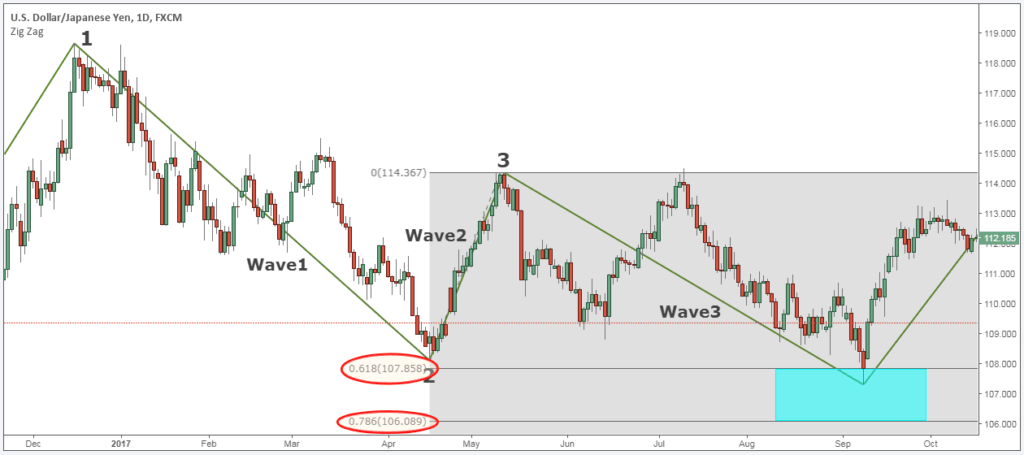
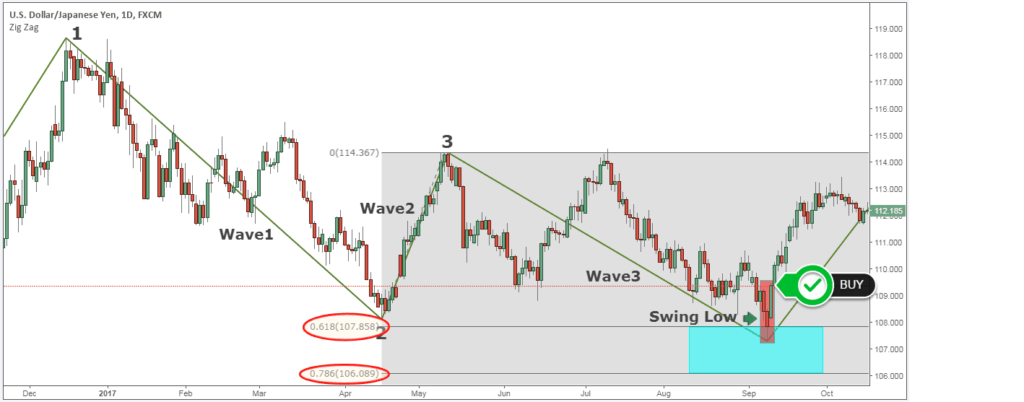
Step 3: Wait for the third wave to end between 0.618 – 0.786 or between 1.0 – 1.272
The fact is that market symmetry does not happen often. The AB = CD template needs a lot of precision to be valid for all of these conditions.
While working with backtesting software, we found that the third wave of the zigzag pattern ends between 0.618-0.786 or 1.0-1.272.
Zigzag indicator strategy for Forex trading
Since we can not be sure where the third wave will end, we intend to use one of our favorite trading techniques to determine a point of fluctuation in the market.
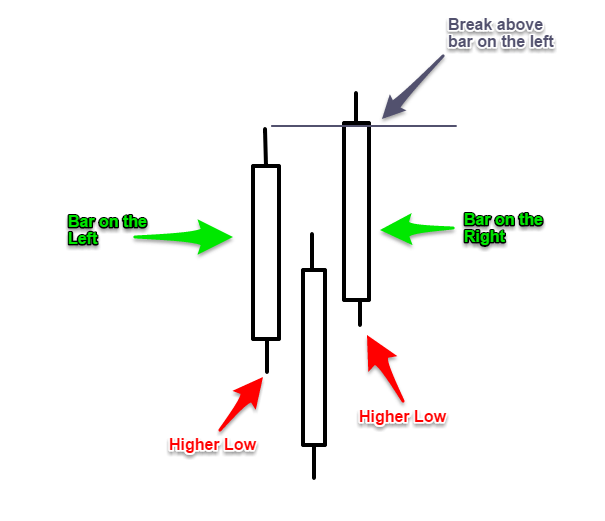
Step 4: Wait until you have a lower candle on the right and left. The right bar should be broken on top of the left bar.
The three bar pattern is very easy to identify a market fluctuation point.
All you have to do is wait for a candle that has fewer candles on both the left and right side. In order for this three-band pattern to be verified, we also need the right band to break from the top of the left band.
Zigzag indicator strategy for Forex trading
To better understand how the low oscillation time is determined, we have created a simple image (see figure above).
Now you need to extend this pattern between 0.618-0.786 or between 1.0-1.272. The Zigzag strategy meets all the conditions of the business, meaning that we can move forward and explain what the conditions are for our inbound strategy.
Step # 5: Zigzag Indicator Strategy: Buy close to the three bar pattern
Once the three-bar pattern is over, we no longer want to lose, and we want to buy in the market. Note that we use the three-bar pattern to predict market volatility points with all our trading strategies.
Zigzag indicator strategy for Forex trading
Step 6: Hide your protective loss under the pattern of the three strips.
Losses will stop below the three bar pattern. Depending on when you trade, your stopped losses may be slightly larger. You want to make sure that the pattern of the three strips in which it is lost retains at least a 2% risk. You do not want to risk more than 2% of your account in any given business.
Finally, we must determine our profit. See below:
Step 7: Earn a profit or profit equal to 2 or 3 times more than the stop loss.
Now, where does our profit goal go?
The classic ABCD pattern basically keeps you in a 1: 1 risk reward ratio. Also, in many cases with the ABCD pattern, you will see very often that those target areas are facing forward.
However, when trading with a zigzag indicator, you can record two or even three times more than the available risks.
Labels: Order to build a Forex robot , Build a stock trading robot , Build a trading robot , Trader robot design , Free Forex Robot , Forex robot programming , Forex Expert Making Tutorial , Build a trading robot with Python , Download Forex Trading Robot , Buy Forex Trader Robot , Automated Forex Robot , Free stock trading robot , Learn how to build a Forex trading robot , Alpari trading robot , Forex robot for Android , MetaTrader robot design , MetaTrader robot programming , Forex robot design , Forex robot programming , Automated trading


