
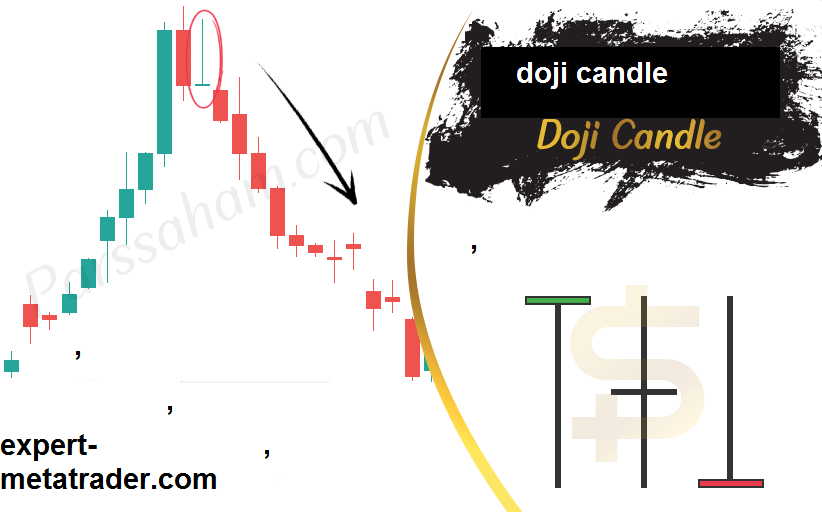
Doji candle is actually the name of a part of candlestick patterns that has a wide variety of uses in technical analysis and the financial market. In this type of pattern, the opening price and the closing price of the share are equal and mostly appear in the form of a combination in the patterns. Be careful, doji candles are a neutral pattern, but they have been able to be included in the list of the most important candlestick patterns.
Using these candles does not require a lot of expertise, but you must consider some important things to avoid problems. By becoming a member of Premium Trading, analysts can benefit from many related trainings and also easily learn about the latest economic news in the world. Therefore, if you also want to increase your awareness in this field, we suggest that you join this channel as soon as possible and do not ignore the content mentioned in the rest of the article.
Features of the Doji candle
Usually, each doji candle in the technical analysis chart provides users with specific information in the time frame that includes the highest price of the candle, the starting price of the candle, the last price of the candle and the lowest price of the candle. If the opening and closing prices of the share are very close to each other, the candle formed is called a doji.
According to how much the lowest and highest price of doji is lower or higher than the body, the size of its shadows will also be different. It is interesting to know that in Japanese, the term doji means mistake or error, which is very important.
Be careful that doji candles should not be evaluated mechanically because they are often a big reversal sign after a strong trend. Most of the time, to detect them, it is better to let them form completely to perform better against them. How long you have to wait for a trend change warning also depends on the risk and return of the trade.
If you want to take a lower risk, it is recommended to be more patient after a doji candlestick occurs, especially in an uptrend, to confirm the trend reversal. It goes without saying that a doji represents a kind of indecision between sellers and buyers in which everyone is equal and the price does not go anywhere.
Introducing the types of doji candles
It is better to know that according to the closing or opening price of the stock as well as the formation of shadows, the Doji candlestick is classified into different categories such as dragonfly candlestick, tombstone candlestick and long base candlestick. Each of these candles has its own characteristics and specifications, which we intend to examine in a more comprehensive way, so stay with us.
A long base doji is very suitable for starting an upward trend and can help analysts a lot.
- Long base doji
A long base doji is a specific pattern that shows indecision in the market to analysts. This pattern is considered an indecisive warning to enter the market after a strong main trend that alerts people to start an uptrend.
Investors who want to make a better decision to hold or sell digital currencies can also get help from valid digital currency signals. The digital currency signal actually helps users to see less possible losses and risks in the market and make the most of the profitable opportunities they have.
A long base doji can be seen both at the floor and at the ceiling, and the formation of one or more of it means the beginning of a break and departure from the pattern in a new trend. In this pattern, the final and initial price of the market are very close to each other and when the price is in a strong downward and upward trend, a long base doji will be considered as an important sign.
With the formation of this doji, it can be recognized that the pressure of supply and demand are in a state of equality and there is also the possibility of a reversal of the trend. In an uptrend, buying pressure is usually greater than selling, so the opening price of the next candle will be lower than its closing price. Of course, it is better to know that with the formation of long base doji, the unfinished war between sellers and buyers is ending.
The process by which buyers used to control the market in the past has now reached a state of equal pressure of demand and supply. For this reason, the price in the long base candle will move up after opening, but the selling pressure will not allow it to close at the same price, and its fall will continue until the starting price of the market. Finally, the same starting price is also closed.
The efficiency of long-base doji is better in upward trends, because it also brings the possibility of trend reversal. Trading in this pattern is divided into 2 performance and return tactics, in both tactics, the return rate of the trend is very important.
However, most traders do not settle for just one candle because the pattern will be formed with only one candle and other methods are needed for trading. Be careful, after the desired pattern is created as the indecision of the market, you should plan your trading strategy in the next candle.
If the price reaches higher than the doji candle, it is better to buy, but if the price falls below the doji candle, it is recommended to register the sale. Otherwise, you should wait for the candlestick structure after the pattern to predict the next price move.
With the help of doji dragonfly, you can see the price increase in the near future and make better decisions for doing various transactions.
- Doji Dragonfly
This doji is a kind of candlestick pattern which, according to the behavior of the past price of the share, can signal the return of the upward or downward trend in the price. A dragonfly doji will form when the high, close or open prices of the stock are the same.
This pattern is often rarely formed, but it can be seen very quickly in technical charts. The long downward shadow in the dragonfly doji will show that there has been continuous selling during the desired candlestick, but the closing price is close to the opening price, and it shows that the buyers have been able to absorb the selling force and also push the price upwards.
Following the downward trend, the dragonfly candle may indicate an increase in the price in the not too distant future. After the upward trend, this pattern shows that relatively more sales have entered the market and there is a possibility of a price decrease.
Note that the dragonfly doji pattern does not occur frequently, but if it appears in a trend, it is considered as a warning sign that can indicate that the existing trend has changed direction or that the strength of the trend has decreased.
Following the price advance of the high and low shadow of the dragonfly will show that sellers can control at least part of the trading period. While the final price is closed without changing and increasing selling pressure is a warning sign.
If at some point in the candlestick pattern the confirmation of price growth is done, the price reversal signal will be invalid and thus the stock will continue to grow. During the decline, the doji dragonfly candlestick indicates that sellers have initially moved strongly, but by the end of the trade, buyers have pushed the price back into the market. This indicates an increase in buying pressure during a downward trend and can lead to an increase in price.
If the close of the stock in the dragonfly confirmation candle is above the close of the desired pattern, the signal will be confirmed. The greater the growth of the dragonfly, the greater the reverse movement and overturning.
Traders can buy very easily when the confirmation candle is completed. After the purchase, in order to return to the upward trend, the loss limit of the transaction should be considered under the lower shadow of the dragonfly candle.
Investors can see better results and take less risk by using the tombstone pattern.
- Doji Tombstone
Tombstone doji is also a bearish inversion pattern, the long shadow above it shows that the upward progress at the beginning of the period of decline will end at the end of the period. Often this price reduction is a long-term decline and you should not be indifferent to it.
This pattern can occur in both downtrends and uptrends, but so far it has been more successful in uptrends. The tombstone pattern, like other doji patterns, displays a kind of indecision in the market, where the price moved up but could not sustain itself and was pulled back.
In this pattern, sellers try to reach new highs during candle formation, but buyers buy near the closing price of the stock. For this reason, it can be said that the long shadow above in the desired pattern represents the failure of the movement of the cows.
Tombstone doji is very popular among analysts, but do not forget that it is not completely reliable and should not be used alone. Therefore, it is better to know that currently some professional analysts and reputable sites such as Persian Elite sell vip indicator and help investors a lot to get more profit. After identifying the tombstone pattern, traders either sell stocks or exit long positions very quickly. Although other candlestick patterns should be used in connection with this analysis as confirmation, many traders ignore this issue.
In order to trade using the tombstone doji candle, it is more likely to be done for a trend reversal because it is better to let the confirmation candle form and then see where the trend goes to implement your trading strategy. All these explanations will depend on the ratio of risk to the return of your transactions, and you should not take inappropriate actions without sufficient knowledge.
Doji candle limitations
The doji candlestick alone is a neutral type of pattern that provides little information. This pattern is not a common occurrence in principle and is important in markets where there are often not many doji candles. For this reason, doji candles are not considered a reliable and suitable tool for considering issues such as price reversal.
In such cases, you can join a popular digital currency signal channel and use the useful information it contains. Note that the size of the lower and upper shadow of the doji candle confirms its occurrence and sometimes causes the entry point to the transaction to be far away from the loss limit.
Therefore, it is better for traders to either give up trading or to find a better place to choose their loss limit so that they get better opportunities for trading and do not lose their capital. Otherwise, it is possible to witness a high loss and there is no possibility to compensate it much.
last word
Doji candle is very important in candlestick patterns of technical analysis because this pattern shows the confusion of traders and can lead to the weakening of the trend. In fact, by observing this pattern, it is better to prepare yourself to start changing the trend because you should not do different transactions based on their observation. In such cases, it is better to wait for the next candle to confirm the signal and not take any adverse actions. To keep your assets, be sure to use online exchanges such as Binance, which are highly reputable. Also, if you do not have enough experience to authenticate Binance, it is better to leave this work to experts so that you do not face more problems later.


Comments (0)