

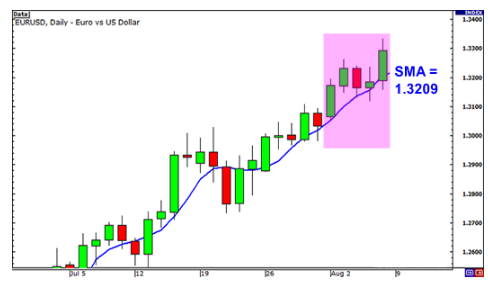
As we said in the previous lesson, spikes (sharp non-market movements) can make simple moving averages misleading. But the story of the moving average is different. We start with an example. Suppose we draw a 5-period SMA indicator on the daily chart of EUR/USD.
Explanation of exponential moving average
Explanation of exponential moving average
The closing prices in the last 5 days are as follows:
• Day 1: 1.3172
• Day 2: 1.3231
• Day 3: 1.3164
• Day 4: 1.3186
• Day 5: 1.3293
The simple moving average is calculated as follows:
(1.3172 + 1.3231 + 1.3164 + 1.3186 + 1.3293) / 5 = 1.3209
Very simple, isn’t it? Well, what if a major news report comes out on day 2 that causes the Euro to crash globally? It causes EUR/USD to fall and close at 1.3000 level. Let’s see how this will affect the period’s 5SMA.
- Day 1: 1.3172
- Day 2: 1,3000
- Day 3: 1.3164
- Day 4: 1.3186
- Day 5: 1.3293
The simple moving average is calculated as follows:
(1.3172 + 1.3000 + 1.3164 + 1.3186 + 1.3293) / 5 = 1.3163
The result of the simple moving average will drop a lot, giving you the impression that the price is going down, when in fact the Day 2 event only happened once, caused by a weak economic report.
The point we are trying to make is that sometimes the simple moving average can be too simple. If only there was a way to filter out these spikes so we don’t get the wrong idea.. hmm… wait a minute… yes, there is a way!
Its solution is called exponential moving average ! The Exponential Moving Average (EMA) gives more weight to recent time periods. In our example above, the EMA gives more weight to the price of the most recent days, which are days 3, 4 and 5.
This means that the spike on day 2 will have little value and will not affect the moving average as much as we would calculate it in a simple moving average. If you think about it, that makes a lot of sense because the result is more emphasis on what traders have been doing recently.
Exponential Moving Average (EMA) vs Simple Moving Average (SMA)
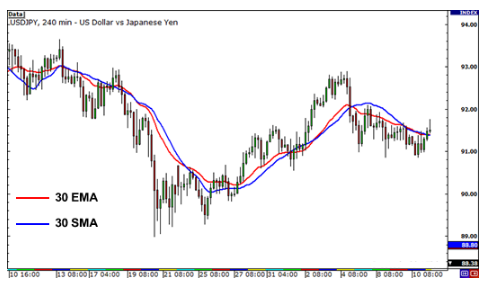
Let’s take a look at the 4-hour USD/JPY chart to see how a simple moving average (SMA) and an exponential moving average (EMA) stack up on the same chart.
Explanation of exponential moving average
Explanation of exponential moving average
Notice how the red line (30 EMA) is closer to the price than the blue line (30 SMA). This means that it shows recent price movements more accurately and correctly. You can probably guess why this happens. This is because the EMA puts more emphasis on what has happened recently. At the moment of trading, it is much more important to see what traders are doing now. And not what they did last week or last month!


Comments (0)