
Price action has many patterns and each of the price patterns is suitable for work. Price action patterns include supply and demand, smart money, El Brooks, Voder, ICT and volume trading. The price action of supply and demand is a topic that we intend to explain in this article. Supply and demand is one of the main parts that every trader should pay attention to. Because when the supply increases, the price of digital currencies decreases and when the demand is greater than the supply, the price of digital currencies increases. Therefore, it is better to measure the supply and demand areas for ourselves and start trading based on them. If you know how to read charts, supply and demand areas, support and resistance will help you a lot.
Labels: Order to build a Forex robot , Build a stock trading robot , Build a trading robot , Trader robot design , Free Forex Robot , Forex robot programming , Forex Expert Making Tutorial , Build a trading robot with Python , Download Forex Trading Robot , Buy Forex Trader Robot , Automated Forex Robot , Free stock trading robot , Learn how to build a Forex trading robot , Alpari trading robot , Forex robot for Android , MetaTrader robot design , MetaTrader robot programming , Forex robot design , Forex robot programming , Automated trading
What is price action?
The price action method is another trading strategy that can be used to easily make money from the digital currency or forex market. Price action includes several methods such as RTM, Smart Money, El Brooks, supply and demand, etc. Among all these price action methods, the Smart Money style is the first; Because using this method, the probability of a trader’s loss is almost zero. If you want to learn this trading strategy, check out the Smart Money training course. Price action methods were all invented by several people and improved over the years. In this article, we are going to introduce you to supply and demand price action and teach you how to find supply and demand areas.
Supply and demand areas
Most people confuse the concepts of supply and demand with the concepts of resistance and support. These two definitions are different and each one has its own application and is used to find out something. In the rest of this article, we are going to explain the supply and demand price action areas so that you can get a better understanding of these two. Also, by reading the article on types of price action methods, you can learn about other price action methods.
Supply
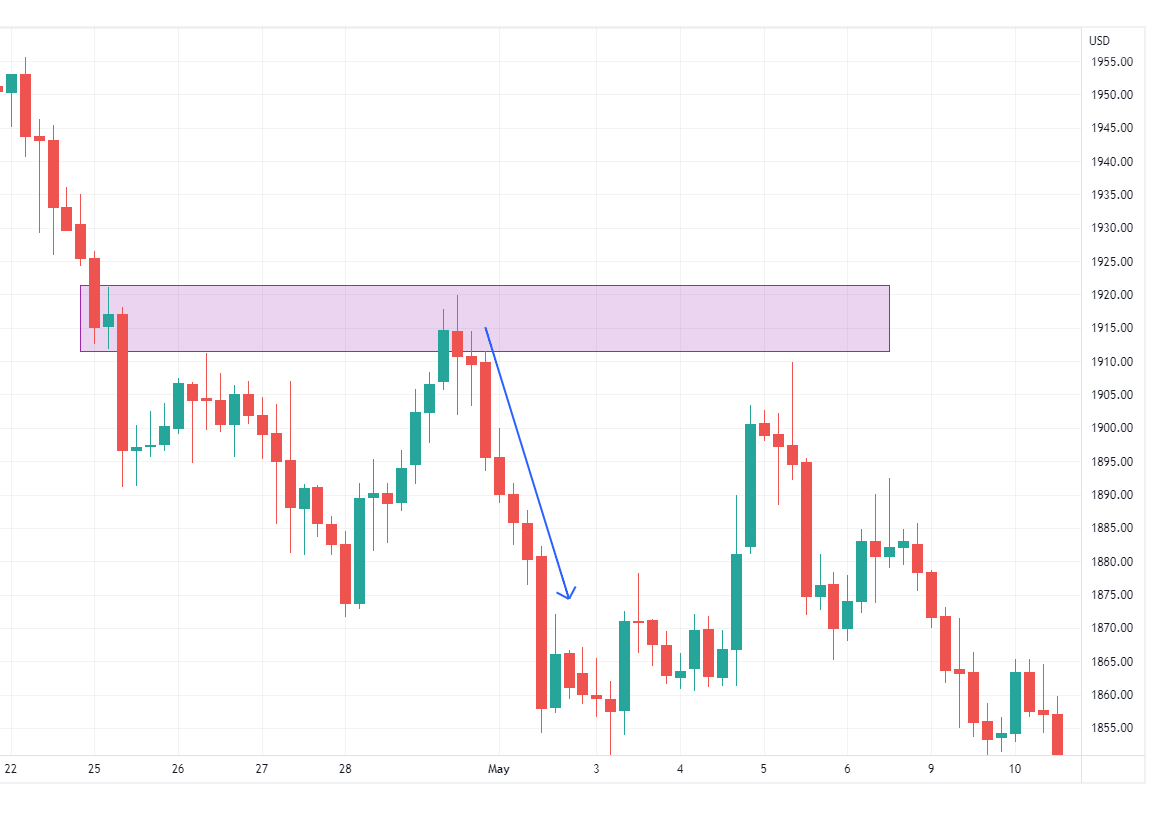
Supply levels can be identified and to find it you need to be familiar with two Japanese candlestick concepts and how to find a cluster. The supply level is usually between two peaks, and between these two peaks, the price of digital currency once fell and rose again and reached the same height as the previous peak or higher. In the image below, the supply level is displayed for you, through which you can better understand these levels.
demand
Demand levels can be identified and to find it, you need to be familiar with the two concepts of the Japanese candlestick and how to find the cluster. The demand level is usually between two peaks, and between these two peaks, the price of digital currency rises once and falls again, and reaches the same height as the previous peak or lower. In the picture below, the demand level is displayed for you, through which you can better understand these levels.
In the above image, the resistance and support areas are also displayed for you. Hence, you can see that these areas are different with supply and demand levels and you should not confuse the two. Also, in the picture above, we have a price floor, which is the support area, when the price falls to this range again, it will move up again. Therefore, investors start buying and selling around these areas, which form supply and demand areas. Another price action method is the RTM price action, which you can combine with the supply and demand method.
Price action patterns of supply and demand
Among the most important supply and demand patterns, we can mention Candlestick, Engulfing and Pin Bar patterns. These two patterns are used for supply and demand price action, which is very useful in identifying supply and demand areas. Therefore, in order to find and confirm these levels better, it is better to know these 2 patterns that are related to the candlestick pattern well or to be somewhat familiar with it.
In order for you to understand these two candles better, look at the picture below. With a better understanding of this issue, you can easily identify supply and demand areas and predict the market’s reversal trend. As you can see in the picture below, after the occurrence of these two candles, the price has returned to an upward trend. If you are one of those people who can’t make good money in the digital currency market, I suggest you to watch the digital currency intelligence course.
As it is clear in the figure, the price has moved towards higher targets after the formation of these two candlestick patterns.
Learning to find supply and demand areas
To be able to find supply and demand areas, you must first change your chart mode to candlestick. After your price chart is converted into a price candlestick chart, it’s time to find these areas. Secondly, you should look for consecutive candles that have large bodies, as they indicate strong reversals. After finding them, you should find the source of these changes and mark them for yourself. Usually, very small candles are created before large price growth occurs, which are the supply and demand levels.
How to find supply and demand areas
The best way to find supply and demand areas is to look at a candlestick chart. Below you can see the order of this process:
- Look at the chart and try to find consecutive candles with large bodies. It is important that price movements are strong.
- Determine the base of fast and strong price movements. To find the origin, you must find the rapid movement in both directions, because then the origin of the movement can be identified.
- Usually, small candles are created before the price trend changes, after which the market trend turns up. These price change areas are exactly the supply and demand areas that we are looking for.
Price action supply and demand
You can use supply and demand levels in your price action trades. Because price action and supply and demand complement each other, hence the best way to confirm these levels is to use the price action analysis method. After finding areas of decline and demand, traders look for price action to execute their trade. Suppose in the candlestick chart the price reaches the demand level again and then the Engulfing pattern occurs and we see the price turn. After this, it is possible that the market will turn around and the price will rise, but still wait for price action confirmations.
Time frames of price action supply and demand
Choosing time frames is another thing that traders should be aware of; Because some strategies work in some time frames and they don’t work in some time frames. Therefore, when you are using supply and demand price action, be familiar with the concept and how to use time frames. The supply and demand style is one of the few methods that provides the same result in all time frames. For example, it is possible to use time frames of 5 minutes and more. Of course, everyone chooses a time frame according to their strategy style.
Traders can get a better view of the market and make wiser decisions by using this method in high time frames (4 hours and more). If you want to enter the market, it is better to use two time frames of 4 hours and daily. In this case, you can more easily check the market and identify the time to enter the market and improve your transactions. Time frames of less than 1 hour lead to many interferences and errors for traders and make their analysis difficult.
Conclusion
Price action is one of the best methods through which people can guess the turning points of the market. Also, price action patterns are used for fluctuation, and through them, market fluctuations can be guessed to some extent. If you are not familiar with volatility, I suggest you read the cryptocurrency volatility training article to increase your holdings. In this article, we tried to introduce you to another price action pattern, using this pattern you can guess when the market trend will change and then start your trade using price action.


Comments (0)