
Average True Range is a volatility indicator. Volatility measures the strength of price action and is often overlooked for clues about market direction. A better known volatility indicator is Bollinger Bands. John Bollinger writes in Bollinger on Bollinger Bands 2002: “High volatility leads to lows and low volatility leads to highs.” How close the upper and lower Bollinger bands are at any given time indicates the amount of volatility the price is experiencing. So we can see that the lines start at a relatively large distance from the left side of the graph and converge as they approach the middle of the graph. After almost touching each other, they separate again, showing a period of high volatility followed by a period of low volatility.
Bollinger Bands are well known and can tell us a lot about what will happen in the future. Knowing that a stock is likely to experience more volatility after moving in a narrow range makes it worth putting that stock on a trade watch list. When a breakout occurs, the stock is likely to experience a wild move. For example, when Hansen Natural Corporation, which has since been renamed Monster Beverage Corporation, broke out of a low volatility range, its price nearly doubled over the next four months. ATR indicator is another way to check volatility.
What is the Average True Range (ATR) indicator?
The Average True Range (ATR) indicator is a technical analysis indicator introduced by market technician Jay Wells Wilder Jr. in his book New Concepts in Technical Trading Systems that measures market volatility by breaking down the entire price range of an asset for that period. .
The Average True Range (ATR) indicator is a price volatility indicator that shows the average price changes of assets over a given period of time. Investors can use this indicator to determine the best time to trade. Average True Range also takes into account gaps in price movement.
ATR indicator is a moving average that usually uses 14 days of actual ranges.
How to calculate the Average True Range (ATR) indicator
Traders can use periods shorter than 14 days to generate more trading signals, that is, in less than 14 days they can generate many trading signals, while longer periods are more likely to generate fewer trading signals. have.
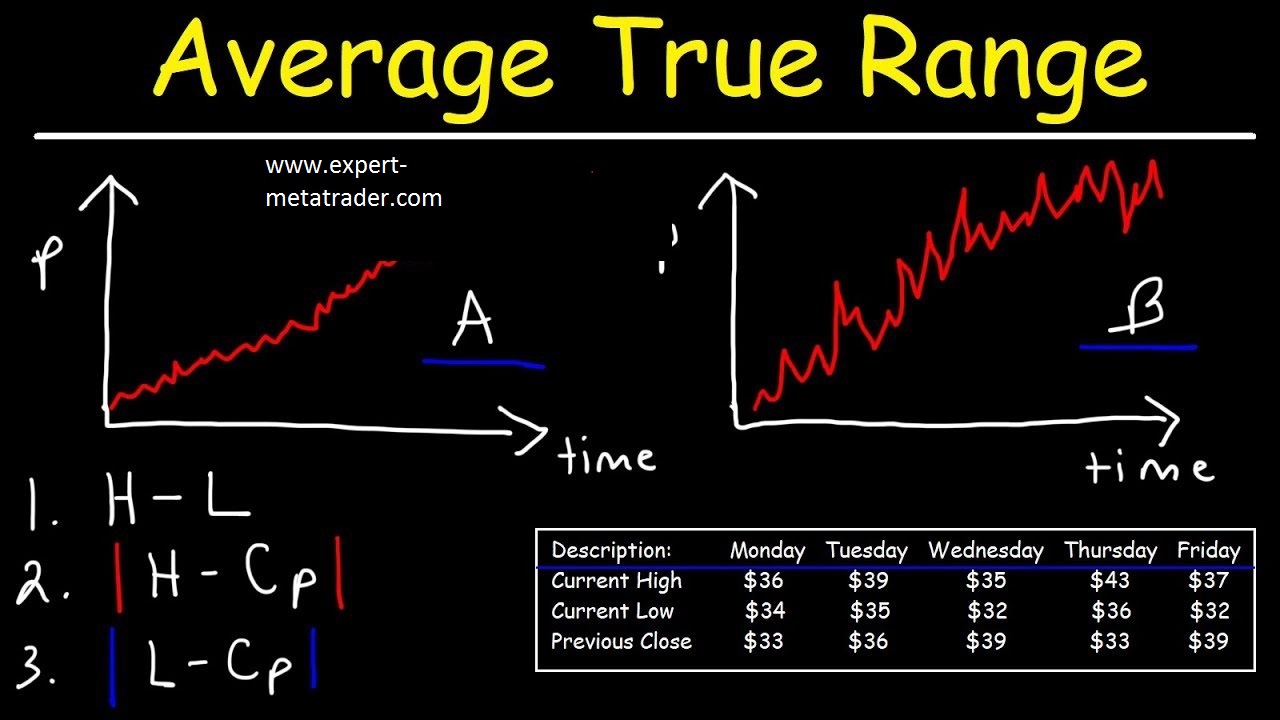
For example, suppose a short-term trader only wants to analyze the volatility of a stock over a five-day trading period. Therefore, the trader can calculate the five-day ATR indicator. Assuming the historical price data is sorted in reverse chronological order, the trader finds the maximum absolute value of the current high minus the current low, the absolute value of the current high minus the previous close, and the absolute value of the current low. Minus the previous close, these true range calculations are performed for the last five trading days and then averaged to calculate the first value of the five-day ATR indicator.
tip
The Average True Range (ATR) indicator is a market volatility indicator, used in technical analysis.
A series of true range indicators is usually derived from the 14-day simple moving average.
The ATR indicator was originally developed for use in commodity markets, but has since been used for all types of securities.
Average True Range Indicator Formula (ATR Calculation)
The moving average of the true range is the moving average of the true range, which is the largest of the following three values:
- The distance from today’s high to today’s low.
- The distance from yesterday’s close to today’s peak.
- The distance from yesterday’s close to today’s low.
Tip: Find the ATR range that works for you. Your swing range can be 0.012 – 0.02. Alternatively, you can be more conservative and trade stocks with a volatility ratio of 0.0025 to 0.0050 on a 5-minute scale.
 The key thing to remember when determining the volatility ratio for your trading style is to stick to the disposable framework. You can’t compare the 5 minute ratio to the daily value, even for the same stock. The common theme is the time frame. Otherwise, you are comparing apples to oranges.
What does the Average True Range (ATR) indicator tell you?
Wilder originally developed the ATR indicator for commodities, although the indicator can be used for stocks and indices as well.
Simply put, stocks that experience high levels of volatility have a higher ATR indicator and stocks with low volatility have a lower ATR indicator.
ATR may be used by market technicians to enter and exit trades and is a useful tool to add to a trading system. It was created for traders to measure the daily volatility of an asset with more precision and focus using simple calculations. The indicator does not show the price direction, but is often used to measure volatility caused by gaps and limit up or down movements. Calculating the ATR indicator is relatively simple and requires only historical price data.
ATR is commonly used as an exit method that can be applied regardless of how the entry decision was made.
One of its popular techniques is known as the “Chandelier Exit”, which was developed by Chuck Lobo. The chandelier exit places a trailing stop below the maximum time you entered the trade. The distance between the highest altitude and the stop level is defined as a multiple of ATR.
For example, we can subtract three times the ATR value from it.
1 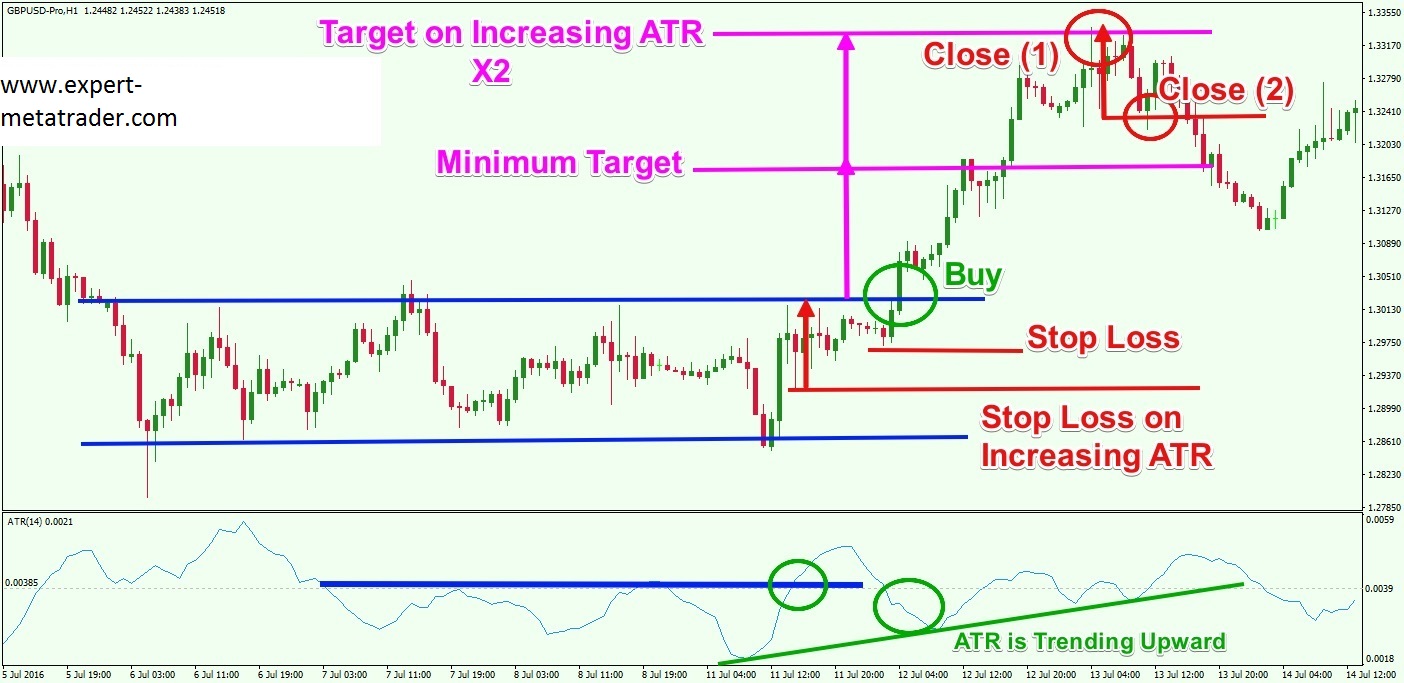 ATR can also show the trader how much to trade in the underlying markets. The ATR indicator approach can be used to measure a position, which reflects a trader’s own willingness to accept risk as well as the volatility of the underlying market.
Chandelier exit indicator
Chandelier Exit is a volatility based indicator that identifies stop loss exit points for long and short trading positions. which is based on the Average True Range (ATR) index. During trading sessions with less volatility, traders set small stop losses. The probability of a trend reversal during trading sessions with low volatility is small. However, in trades with higher volatility, traders set larger trailing losses to protect themselves against volatile trades. Traders use the Chandelier Exit as a stop loss, and a way to protect themselves from losses caused by trend reversals.
Example of how to use Average True Range (ATR)
As an example, suppose the first five-day ATR is calculated at 1.41 and the sixth day has an actual range of 1.09. The value of the trailing ATR indicator can be estimated by multiplying the previous ATR value by the number of days less than one, and then adding the actual range of the current period to the product.
Then, divide the total by the selected time period. For example, the second ATR value is estimated to be 1.35 or (1.41 * (5 – 1) + (1.09)) / 5. The formula can then be repeated over the entire time period.
Although the ATR indicator does not tell us in which direction the breakout will occur, it can be added to the closing price, and the trader can buy whenever the next day’s price breaks above that trade value. This idea is shown below. Trading signals rarely occur, but usually see significant breakout points. The logic behind these signals is that whenever the price closes above the ATR indicator above the last close, a change in volatility has occurred. Taking a long position bets that the stock will follow an upward trend.
Average True Range (ATR) Limits
There are two main limitations to using the ATR indicator.
- The first is that ATR is a subjective measure, meaning it is open to interpretation. There is no single ATR value that can tell you with certainty whether a trend is about to reverse or vice versa. Instead, ATR readings should always be compared to previous readings to get a sense of the strength or weakness of a trend.
- Second, ATR only measures volatility, not the direction of an asset’s price. That can sometimes lead to different signals, especially when markets are experiencing reversals or when trends are at turning points. For example, a sudden rise in the ATR indicator following a large move against the prevailing trend may lead some traders to think that the ATR is confirming the old trend. However, this may not be the case in reality.
How to understand trading with the ATR indicator? The question traders face is how to profit from the swing cycle?! While ATR does not tell us in which direction the breakout occurs, it can be added to the closing price and the trader can buy whenever the next day’s price is above that trade value. This idea is shown below.
Using the ATR indicator indicator
ATR is an important indicator. When used correctly, it can increase your profits and reduce your losses. The biggest misconception about the ATR indicator is that traders mistakenly believe that a higher ATR value means an uptrend and a lower ATR value means a downtrend. This notion is wrong and far from reality.
The ATR indicator does not say anything about the direction of the trend.
How to place indicators on another indicator?
Using the TradingView platform, once you have connected the ATR indicator, simply hover over the ATR indicator window. Right click and select “Apply Indicator on ATR”. Another window will open where you can select the moving average using the 20 point.
Trading with the ATR indicator
Traders expect the ATR indicator to accurately show and predict the daily price movement of an asset. You can use this information to determine the profit target distance, stop loss from the entry.
For example, if the ATR indicator shows a value of 100 pips and the trend you see has exceeded 100 pips, the trend is more likely to end.
Using the ATR indicator for stop loss
You can also use the ATR indicator to place your stop loss. Since the ATR indicator shows you how far the price will move, you can set your stop loss accordingly. By setting your stop loss based on the daily range of the asset’s price movement, you can effectively avoid market noise.
If the price reaches your loss limit after that, it means that the daily price range is increasing in the opposite direction of your trade and you should reduce your loss as soon as possible.
After that it is optimal to use some ATR indicator for stop loss, as it allows you to place your stop loss at the maximum distance and avoid any market noise, while using the shortest stop loss. You may use to do this.
Average percentage of true range
The average percentage of actual range is shown as (ATRP). ATRP is used to calculate volatility, just like the Average True Range (ATRP) (ATR) allows comparison of securities, while the ATR indicator does not.
The ATR indicator channels volatility in absolute terms, meaning stocks will be short at lower prices. ATRP displays the indicator as a percentage to allow comparison of securities with different costs per share.
which is calculated as follows:
Average percent true range = (Average true range / close) * 100
last word
In this article, you got to know the concept of Average True Range (ATR) indicator. In Persian Elite, you can buy vip indicator to increase the profit of your digital currency transactions with correct technical analysis. In addition, you can get an exceptional and special opportunity from benefits such as membership in the digital currency signal channel, Binance authentication and buying Tether on this website.


Comments (0)