

Description
Ichimoku indicator training
Ichomoko MetaTrader 4 Forex Automated Trading Strategy Maker
This indicator was first designed by a Japanese journalist named Goichi Hosoda in the 1930s. At first glance, this indicator seems a bit complicated, but it is one of the most widely used and useful indicators, and the signals obtained from it are well defined. Ichimoku Kinko Hyo is a translated one look equilibrium chart . The meaning of this sentence, if we want to express it, is that by looking at the chart, analysts can identify the trend and then look for buy and sell signals.
Applications of the Ichimoku indicator
- Identify share trends
- Check points of support and resistance
- Identify the direction and strength of the process
- Obtain important information from the stock in a short period of time
- Signals based on the entry and exit of the share
- Specify the loss limit
- Identify stock price return points
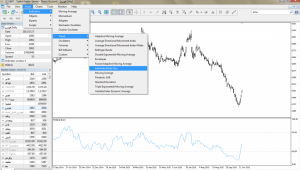
How to add an indicator in the application
Ichomoko MetaTrader 4 Forex Automated Trading Strategy Maker
As shown in the image above, it is categorized in the indicators section and in the trend indicators section.
Ichomoko MetaTrader 4 Forex Automated Trading Strategy Maker
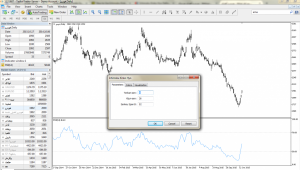
As shown in the image above, it consists of three parts with different time periods in each.
What are the Ichimoku indicators?
Labels: Order to build a Forex robot , Build a stock trading robot , Build a trading robot , Trader robot design , Free Forex Robot , Forex robot programming , Forex Expert Making Tutorial , Build a trading robot with Python , Download Forex Trading Robot , Buy Forex Trader Robot , Automated Forex Robot , Free stock trading robot , Learn how to build a Forex trading robot , Alpari trading robot , Forex robot for Android , MetaTrader robot design , MetaTrader robot programming , Forex robot design , Forex robot programming , Automated trading
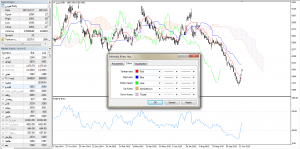
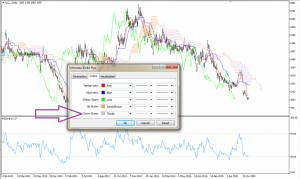
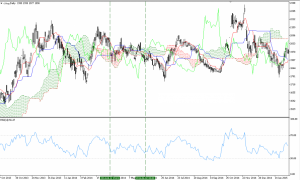
In the following image, in the Colors section of the software, different parts are well shown:
Ichomoko MetaTrader 4 Forex Automated Trading Strategy Maker
- Kijun Sen (Blue Line): This line is called the standard line. The calculation method is that the average of the highest price is calculated with the lowest price in a period of 26 days.
Ichomoko MetaTrader 4 Forex Automated Trading Strategy Maker
- Tenkan Sen (red line): This line is known as the return line. The method of calculation is that the average maximum and minimum price is calculated in a period of 9 days.
Ichomoko MetaTrader 4 Forex Automated Trading Strategy Maker
- Chikou Span ( Green Line ) : This line is known as the delay line and it is calculated in such a way that the closing price today represents the price of the last 26 days.
Applications of Chikou Span in Ichimoku indicator training
- Identify trading trends
- Identify the support and resistance points of the share
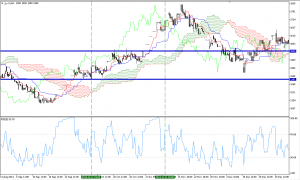
Protection

Ichomoko MetaTrader 4 Forex Automated Trading Strategy Maker
Resistance
Ichomoko MetaTrader 4 Forex Automated Trading Strategy Maker
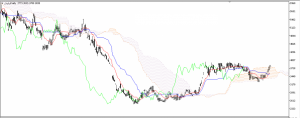
Consider the following example:
Ichomoko MetaTrader 4 Forex Automated Trading Strategy Maker
In general, it is not necessary to know how to calculate each of these lines, the important thing is to know what interpretation and application of each of these lines.
Ichomoko MetaTrader 4 Forex Automated Trading Strategy Maker
The chart above shows Rakish’s share of daily timeframes. The signals that are obtained from different lines in the image above are as follows:
Kijun Sen (Blue Line): These lines are used to identify the rate of change in future share trends. Thus, if the price is above the blue line, it means that the share trend will be upward, and when the price is below the Kijun Sen line, there is a possibility that the share trend will be downward.
Tenkan Sen (red line): This line is mostly used to identify trends. When it moves up and down, it means that there is a trend in the market, and whenever it comes in horizontally, we will not see a particular trend in the market.
Identify trends by these two lines
Uptrend: When Tekan sen crosses the Kijun sen line upwards, we see an uptrend. Consider the following example:
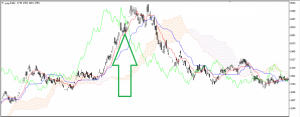
Ichomoko MetaTrader 4 Forex Automated Trading Strategy Maker
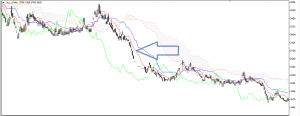
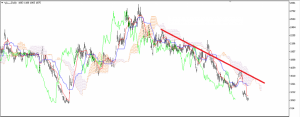
Downward trend: Whenever Kijun sen crosses the Teken sen line upwards, we see a downward trend in the share trend. Consider the following example:
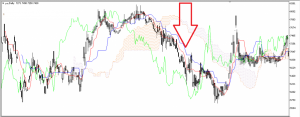
Ichomoko MetaTrader 4 Forex Automated Trading Strategy Maker
Take a look at the image below, which is the daily chart of the news, showing the trend of shares along with changes in KS and TS at the same time.
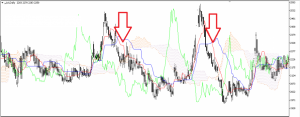
Ichomoko MetaTrader 4 Forex Automated Trading Strategy Maker
Chikou Span ( green line ): The signals that can be used using this line include the following:
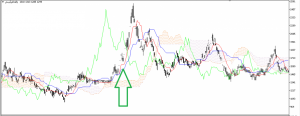
- When the green line crosses the price chart from the bottom to the top, it is a buy signal.
- When the green line crosses the price chart from top to bottom, a sell signal is detected.
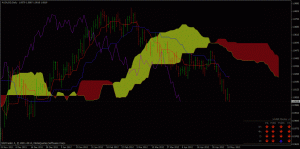
Como cloud in Ichimoku indicator training
In Down software, it is marked in purple, which is confirmed by the following figure:
Ichomoko MetaTrader 4 Forex Automated Trading Strategy Maker
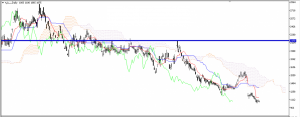
The image below is an example of a downtrend confirmed by the downtrend supercom.
Ichomoko MetaTrader 4 Forex Automated Trading Strategy Maker
These Como cloud lines consist of two lines:
Senkou span A: which is obtained by obtaining the average of Tenkan sen and Kijun sen over a period of 26 days.
Senkou span B: is obtained by obtaining the average maximum and minimum price in a period of 52 days.
Buy and Sell Signals in Ichimoku Indicator Training
- Buy signal: when the red line (for Tekan sen) above the blue line (kijun sen) . At the same time, both the line at the top of the cloud Como are a sign of a bullish trend contribution is an example Note: [user_id]
Ichomoko MetaTrader 4 Forex Automated Trading Strategy Maker
- Sell Signal: If the blue line (kijun sen) is above the red line (Tekan sen), and both of these lines are at the bottom of the cumo cloud at the same time, it indicates a downward trend in the share. Consider the following example:
Ichomoko MetaTrader 4 Forex Automated Trading Strategy Maker
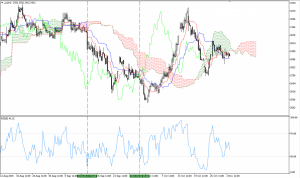
Neutral signal
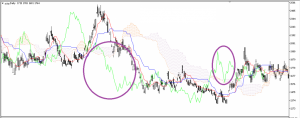
When the price is inside the Como cloud, no action should be taken to buy or sell the stock.
Because in these circumstances, the share trend is not well known. Consider the following example:
Ichomoko MetaTrader 4 Forex Automated Trading Strategy Maker
Labels: Order to build a Forex robot , Build a stock trading robot , Build a trading robot , Trader robot design , Free Forex Robot , Forex robot programming , Forex Expert Making Tutorial , Build a trading robot with Python , Download Forex Trading Robot , Buy Forex Trader Robot , Automated Forex Robot , Free stock trading robot , Learn how to build a Forex trading robot , Alpari trading robot , Forex robot for Android , MetaTrader robot design , MetaTrader robot programming , Forex robot design , Forex robot programming , Automated trading


Reviews
There are no reviews yet.