

Description
Stochastic indicator training
The Stochastic Indicator provides you with information about the momentum and strength of the trend. In fact, this indicator determines the speed and strength of price movements. But how does this indicator work and what points should be observed when using it? In this part of Capital House, we answer all these questions. If you are also curious about the stochastic indicator, stay tuned for the rest of this talk.
Topics of this article
- 1 What is the meaning of stochastic indicator?
- 1.1 How does Stochastic Montage measure price?
- 1.2 Example of stochastic in the upper area
- 1.3 Calculations
- 1.4 An example of a stochastic in the lower region
- 1.5 The story of buying saturation versus selling saturation
- 1.6 Get acquainted with the trading signals of the stochastic indicator
What is meant by stochastic indicator?
Labels: Order to build a Forex robot , Build a stock trading robot , Build a trading robot , Trader robot design , Free Forex Robot , Forex robot programming , Forex Expert Making Tutorial , Build a trading robot with Python , Download Forex Trading Robot , Buy Forex Trader Robot , Automated Forex Robot , Free stock trading robot , Learn how to build a Forex trading robot , Alpari trading robot , Forex robot for Android , MetaTrader robot design , MetaTrader robot programming , Forex robot design , Forex robot programming , Automated trading
Perhaps we can hear the best definition of a stochastic indicator from its inventor. “The stochastic indicator measures the price movement of the stochastic indicator, ” says Georg Lane , the inventor of the stochastic indicator . Imagine launching a rocket into the air. If the rocket wants to land, it must be turned off, and if it wants to be turned off, it must slow down. “Likewise, the momentum situation always changes before the price itself .” From Georg Lane, we conclude that the direction of price movement does not change suddenly. Rather, at first the dominant trend slows down and then its direction changes over time and in several stages. This market behavior is often quite visible in the analysis of the previous price wave of each chart.
How does Stochastic Montage measure price?
The stochastic indicator is based on the default 5 or 14 period settings. In most cases, when analyzing the price chart, we limit ourselves to the settings of the 5th period. But its use is not much different from the 14th period. The Stochastic Indicator of Absolute Floors and Ceilings – the highest and lowest points – examines the chart and compares them to the closing price of the selected period.
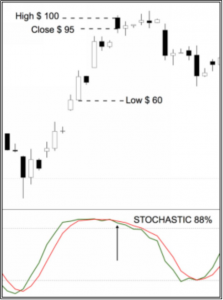
An example of a stochastic in the upper area
Stochastic reach to the upper area means that the price has closed near the ceiling of the last 5 or 14 candlesticks. In the chart below, the highest price during the last 5 candlesticks was $ 100, the lowest was 60 and the closing price was close to $ 95. Stochastic also shows us the number 88 (percent). Therefore, the price is only 12% (88-100) lower than the price ceiling of this period. With such information we can understand stochastics in a much better way. In fact, being stochastic in the upper area means that prices are closing near the absolute ceiling – during a numerical period – and that buyers are now in control of the market.
Calculations
- Lowest price on the last five candlesticks: $ 60
- Highest price level in the last five candlesticks: $ 100
- Closing price: $ 95
The above calculation formula

Metatrader 4 Forex Stochastic Automated Trading Strategy Maker
The stochastic indicator measures the strength of price movements in the direction of the dominant trend and shows how the price closes, above the ceiling or below the floor of the current trend.
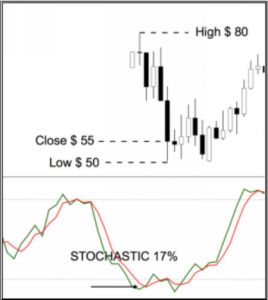
An example of a stochastic in the lower region
Contrary to the above conditions, the stochastic is in the lower area, which means “the price closes near the lowest chart area during the last 5 candlesticks.” In the image below, we see that the stochastic has reached 17 (percent) and this stochastic value is a sign of approaching the last price floor of the chart.
Calculations
- Lowest price on the last five candlesticks: $ 50
- Highest price on the last five candlesticks: $ 80
- Closing price: $ 55
The above calculation formula
![]()
Metatrader 4 Forex Stochastic Automated Trading Strategy Maker
In this graphic example, the stochastic value has reached 17%. These conditions indicate that the price has closed near its last floor during the downtrend.
The story of buying saturation versus selling saturation
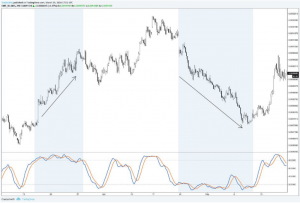
Common interpretive errors in saturated trading areas also apply to the stochastic indicator. In general, stochastic above 80 is considered a buy saturation and less than 20 is a sell saturation. But we should not overestimate the chances of price returns in these areas. We saw earlier that stochastic in the lower region only means stronger downward movements. Similarly, the buy saturation zone does not just mean a price return, but only a strong uptrend. Based on the conditions in the image below, strong trend movements are usually performed when the stochastic is in the saturation zone of buying or selling. Therefore, traders who are just trying to take a sell-off position due to the stochastic entry into the buying saturation zone will soon lose their capital due to wrong trading decisions. Because they have a completely wrong understanding of the trading tools at their disposal.
Metatrader 4 Forex Stochastic Automated Trading Strategy Maker
Saturated areas of buying and selling are not signals of a return to the price trend. The rise or fall of prices may continue for a long time. Because the stochastic in the upper and lower area shows only a strong strong trend.
Get acquainted with the trading signals of the stochastic indicator
Labels: Order to build a Forex robot , Build a stock trading robot , Build a trading robot , Trader robot design , Free Forex Robot , Forex robot programming , Forex Expert Making Tutorial , Build a trading robot with Python , Download Forex Trading Robot , Buy Forex Trader Robot , Automated Forex Robot , Free stock trading robot , Learn how to build a Forex trading robot , Alpari trading robot , Forex robot for Android , MetaTrader robot design , MetaTrader robot programming , Forex robot design , Forex robot programming , Automated trading
A quick and accurate interpretation of the stochastic indicator requires knowing a few things, which we will tell you in the following:
- Price failure: According to the image below, if the stochastic rises too sharply and suddenly and the two lines in the indicator are separated from each other, in most cases, it will be a possible sign of the beginning of a new price trend. In fact, that signal reminds us that the momentum is rising and the price is reaching higher than its price ceiling during the last 14 candlesticks. If these conditions are accompanied by price breaks from the neutral areas of the chart, it strengthens the initial trading signal. As shown in the figure, it is possible to draw trend lines in the indicator window to receive confirmation of failure as a trading signal.
Metatrader 4 Forex Stochastic Automated Trading Strategy Maker
The price failure of the stabilization phase is associated with the failure of the trend line in the stochastic indicator and confirms the momentum increase in the price.
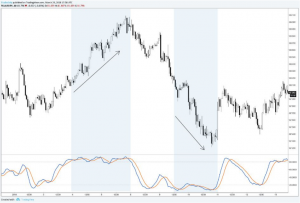
- Trend-based trading: As long as Stochastic continues to move in one direction, the price trend will continue. In other words, you should not fight stochastic in the process of technical analysis! In fact, using this information to capture trading opportunities with a higher probability of winning seems like a smarter solution.
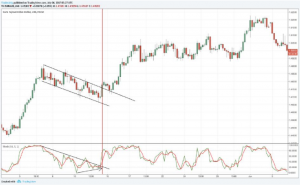
- Strong trends: If Stochastic is in the saturation zone of buying or selling, you should maintain your trading position. Because the possibility of a very strong trend is not far from expectation. Even if the price is at the end of the buy or sell saturation zone, it does not mean a complete change in the direction of the trend. In some common trading strategies, buy or sell saturation zones are used as potential entry points. For example, one of the hypothetical theories is that if the price goes out of the saturation zone of buying or selling, it is appropriate to enter into a transaction by evaluating other conditions. The image below depicts a situation where the stochastic is on the edge of its oscillating range. In this chart, you can see how much potential there is for the long-term continuation of market trends in saturated buying and selling areas.
Metatrader 4 Forex Stochastic Automated Trading Strategy Maker
Even if a trend is eventually reversed after being in saturated buying or selling areas, prices have been rising or falling for a long time. Traders should never take on a new trading position based on the likelihood of a reversal due to stochastic entry into saturated buying or selling areas. On the other hand, trading based on signals is a more appropriate course of action when the indicator enters these areas.
Divergences
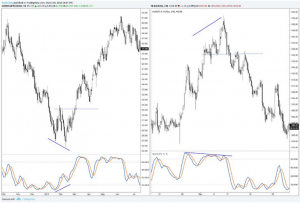
Like other momentum indicators, the divergence of the stochastic indicator is an important sign to identify a possible reversal scenario. If the price and the indicator show conflicting signals, this condition indicates a divergence. The image below shows such a scenario:
“However, the price on the left has created a lower floor. “But at the same time, the stochastic shows a decline in the strength of the downtrend by creating a higher floor.”
Metatrader 4 Forex Stochastic Automated Trading Strategy Maker
Therefore, traders should not buy trading positions or leave all their focus on selling positions. Instead, they should wait for signals to close at the right time. In this situation, traders, contrary to the trend, wait for the price to record a newer ceiling and receive the necessary entry signal. Divergences combined with the failure of roof and floor surfaces can provide strong signals of a return to trend.
Conclusion
This indicator is used to identify the support and resistance points in the share process and is in the same range that is fully examined to identify buying saturation points and selling saturation points . The settings of this indicator depend on the trading perspective of traders. When we choose a short time frame, we see a lot of fluctuations in saturation points (buy and sell). But if we choose longer time frames, the fluctuations are less palpable because the trading time is longer. Finally, this indicator allows the trader to measure the speed and acceleration of the price .
Labels: Order to build a Forex robot , Build a stock trading robot , Build a trading robot , Trader robot design , Free Forex Robot , Forex robot programming , Forex Expert Making Tutorial , Build a trading robot with Python , Download Forex Trading Robot , Buy Forex Trader Robot , Automated Forex Robot , Free stock trading robot , Learn how to build a Forex trading robot , Alpari trading robot , Forex robot for Android , MetaTrader robot design , MetaTrader robot programming , Forex robot design , Forex robot programming , Automated trading


Reviews
There are no reviews yet.