Description
Parabolic SAR indicator training
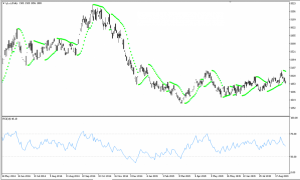
This indicator was created by a person named Welles Wilder. This indicator has been identified as trend-following indicators. It also identifies the return points of the share price. The chart shows the dots at the top and bottom of the price. Note the following image, which is a sample of Kasapa’s share in the daily time frame:
Parabolic SAR MetaTrader 4 Forex Automated Trading Strategy Maker
As you can see, the Parabolic Indicator is a dotted line at the top and bottom of the price chart.
Identify trends through the Parabolic Indicator
Labels: Order to build a Forex robot , Build a stock trading robot , Build a trading robot , Trader robot design , Free Forex Robot , Forex robot programming , Forex Expert Making Tutorial , Build a trading robot with Python , Download Forex Trading Robot , Buy Forex Trader Robot , Automated Forex Robot , Free stock trading robot , Learn how to build a Forex trading robot , Alpari trading robot , Forex robot for Android , MetaTrader robot design , MetaTrader robot programming , Forex robot design , Forex robot programming , Automated trading
Trend detection by this indicator is in two ways:
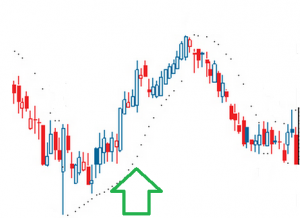
- When the share trend is bullish, the dotted line is at the bottom of the price. This is where the buy signal comes in. Consider the following example:
Parabolic SAR MetaTrader 4 Forex Automated Trading Strategy Maker
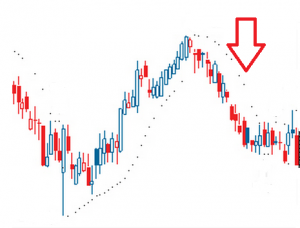
2. When the stock trend is down, the dotted line is at the top of the price and this is considered as a signal to sell the stock. Consider the following example:
Parabolic SAR MetaTrader 4 Forex Automated Trading Strategy Maker
- One of the important features of this indicator is that it shows that there are many investment opportunities for the trader at any point in time.
- Identify return and stop points in the share process
- When the new share trend is not confirmed and (Fail), using this indicator, the trend reversal can be detected.
- Identify where the loss limit order should be placed. Note the following figure regarding trend change, using the Parabolic indicator:

Parabolic SAR MetaTrader 4 Forex Automated Trading Strategy Maker
How to add Parabolic SAR in useful trader software

Parabolic SAR MetaTrader 4 Forex Automated Trading Strategy Maker
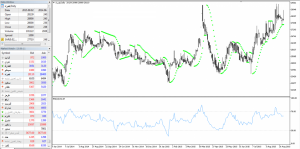
First in the logarithmic diagram, by selecting the INSERT option and then INDICATOR, the Parabolic indicator is specified.
Parabolic SAR MetaTrader 4 Forex Automated Trading Strategy Maker
Indicator settings in the useful trader software
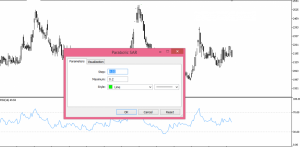
Parabolic SAR MetaTrader 4 Forex Automated Trading Strategy Maker
In most cases, the settings are a bit of an indicator.
Simultaneous use of Parabolic and ADX indicators
Note the following diagram:
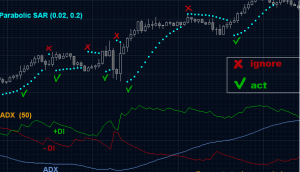
Parabolic SAR MetaTrader 4 Forex Automated Trading Strategy Maker
As we can see, when the ADX is in a positive position, the Parabolic indicator is in an uptrend, and vice versa.
Conclusions in Parabolic SAR indicator training
It is recommended to use this indicator to identify price return points. Another important application of this indicator is that it easily examines the possibility of identifying entry and exit points in the share. And as we know, this indicator should be used along with other indicators.
Labels: Order to build a Forex robot , Build a stock trading robot , Build a trading robot , Trader robot design , Free Forex Robot , Forex robot programming , Forex Expert Making Tutorial , Build a trading robot with Python , Download Forex Trading Robot , Buy Forex Trader Robot , Automated Forex Robot , Free stock trading robot , Learn how to build a Forex trading robot , Alpari trading robot , Forex robot for Android , MetaTrader robot design , MetaTrader robot programming , Forex robot design , Forex robot programming , Automated trading


Reviews
There are no reviews yet.