

Description
Introducing AO – Awesome Oscillator
Awesome MetaTrader 4 Forex Automated Trading Strategy Maker
In this article, we want to introduce an indicator called Awesome Oscillator to you dear ones and teach you how to receive signals and the strategy of trading with this AO indicator.
The creator of this indicator (Bill Williams) has chosen a very appropriate name for it. The word Awesome in English means great and amazing, and in fact, this indicator is one of the best indicators for trading on the stock exchange.
But let’s get to the heart of the matter faster and look at what this indicator really is, what it does, and how it can help us trade the stock market.
2) Awesome Oscillator indicator formula
3) Trading strategy with AO indicator
3.1) 1- Cross indicator with zero line
What is an Awesome Oscillator?
Labels: Order to build a Forex robot , Build a stock trading robot , Build a trading robot , Trader robot design , Free Forex Robot , Forex robot programming , Forex Expert Making Tutorial , Build a trading robot with Python , Download Forex Trading Robot , Buy Forex Trader Robot , Automated Forex Robot , Free stock trading robot , Learn how to build a Forex trading robot , Alpari trading robot , Forex robot for Android , MetaTrader robot design , MetaTrader robot programming , Forex robot design , Forex robot programming , Automated trading
The Awesome Oscillator is actually an oscillator, as its name implies. Unlike indicators such as the RSI or the Slow Stochastic Indicator, each of which has its own limits and fluctuates within a certain range, the Awesome Oscillator is borderless and has no upper or lower limits.
In a situation where many of you may think that this indicator is made with a series of very advanced algorithms by a scientist from MIT, we must tell you that this is not the case at all! This algorithm is not complicated at all. This indicator uses only two Moving Average characteristics to perform its calculations. Note the two characteristics of Simple Moving Average, not EMA or Displaced Moving Average, which have their own complexities.
Awesome Oscillator Indicator Formula
If you have basic math information, you can easily do the calculations for this indicator yourself. This indicator, like many other indicators, calculates two Moving Average charts at two different time intervals and retells the results.
Comparing the moving average in two different time periods is very common in many indicators. But what is the difference between Awesome Oscillator here?
Awesome Oscillator Unlike many indicators that take into account the close price of a candle for these calculations, the average price of that candle (the middle price of the candle) is taken into account for the calculation.
For a better understanding, here is the formula for performing the calculations used by this indicator:
Fast Period = (Simple Moving Average (Highest Price + Lowest Price)/2, x periods)

Slow Period = (Simple Moving Average (Highest Price + Lowest Price)/2, x periods))
Explanation of Awesome Oscillator formula
Let’s take a closer look at what the formula for this indicator says exactly.
As you can see, in these formulas we use the letter X for time periods. This X indicates the number of time periods in which you want this indicator to use the corresponding candlesticks to perform the calculations.
In general, the most common modes used by traders in the world are 5 time periods for fast mode and 34 time periods for short mode. That is, you should use 5 instead of X in the fast time period, and 34 instead of X in the short time period.
But we must remember that it is you who decides how long to use this indicator. You do not have to use these numbers. These numbers are the most common.
Awesome Oscillator and its chart
Depending on the software you are using, the AO indicator can appear in a variety of formats. However, the most common format in which this indicator appears on most platforms is a histogram.
The Awesome Oscillator will fluctuate between positive and negative territory. When the histogram is positive, it means that the faster moving average is higher than the slower moving average, and vice versa when the histogram is negative. Just like the MACD indicator.
It should be noted that the color of the AO histogram bars indicates the movement of moving averages. This means that the green histogram means the moving averages are approaching each other and the red bars indicate the distance of the moving averages. So in the negative and positive we can have green and red bars.
Trading strategy with AO indicator
Now that we are familiar with this indicator, let’s see how we can use it for trading in financial markets. There are several ways that this indicator can be used to receive buy and sell signals.
1- Cross indicator with zero line
If you use this strategy alone, you will lose your money! This is a famous phrase about all strategies that are designed based on an indicator. But it is safe to say that this simple strategy works most of the time.
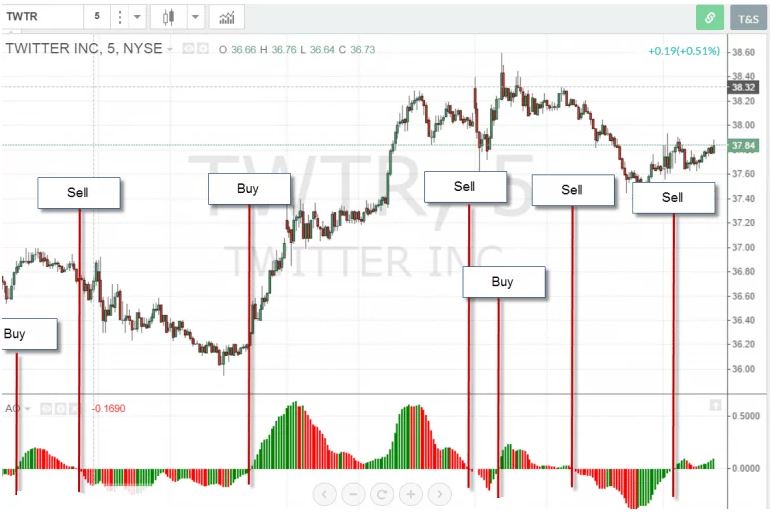
A buy signal is issued if the OA indicator is crossing zero from the bottom up. A sell signal is issued while the indicator is moving from positive to negative. Just as easily!
Let’s look at a real example to see how this strategy works in practice.
Awesome MetaTrader 4 Forex Automated Trading Strategy Maker
In the example above (at 5 minutes timeframe), there were 7 signals that the AO indicator had crossed the 0 line. Out of 7 signals, 2 signals were able to record significant movements. Therefore, it has little use in low time frames. Especially in Iran Stock Exchange where you have to pay a high fee.
Labels: Order to build a Forex robot , Build a stock trading robot , Build a trading robot , Trader robot design , Free Forex Robot , Forex robot programming , Forex Expert Making Tutorial , Build a trading robot with Python , Download Forex Trading Robot , Buy Forex Trader Robot , Automated Forex Robot , Free stock trading robot , Learn how to build a Forex trading robot , Alpari trading robot , Forex robot for Android , MetaTrader robot design , MetaTrader robot programming , Forex robot design , Forex robot programming , Automated trading
2- UFO strategy!
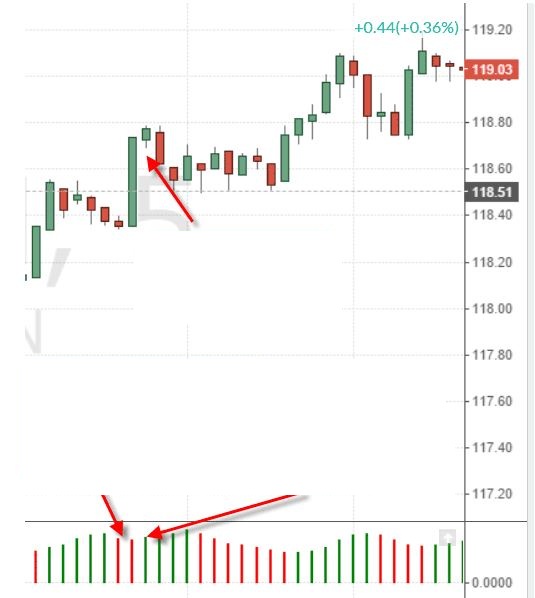
The UFO strategy got its name because it looks like a UFO. The main base of this strategy is designed based on three histograms for long and short intervals.
Strategy conditions for entering into a deal:
- The indicator is above zero
- View two consecutive red histograms
- The second red histogram is shorter than the first
- The third histogram is greener and taller than the previous candlestick
- Shopping at the fourth candlestick
Awesome MetaTrader 4 Forex Automated Trading Strategy Maker
The UFO strategy is slightly better than the zero line cross because it requires a specific formation in the three histograms. Naturally, this happens less on the chart.
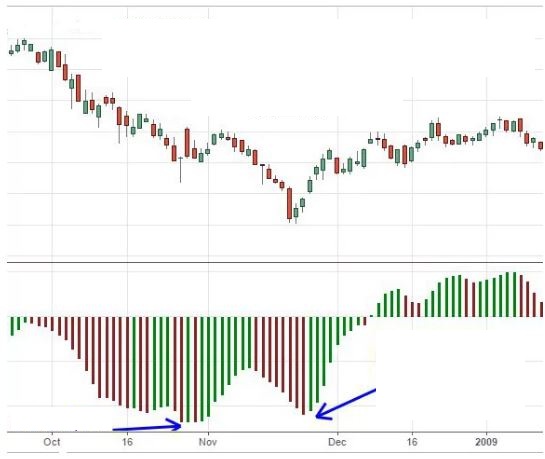
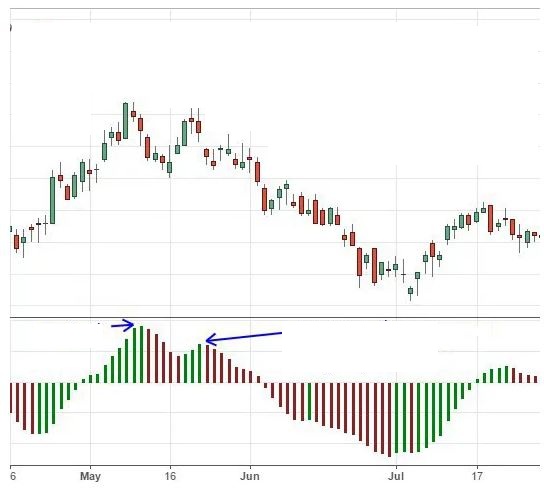
3- Twin peaks strategy
This indicator determines the market momentum and strength of the trend and is used to find the end of a strong trend (up or down). Also, from this strategy, even alone, good buy and sell signals can be received. The interesting thing about this indicator is that it emits a variety of signals in different ways, one of the best of which is the twin peak strategy.
- The buy signal is formed by forming two inverted peaks, the second peak being shorter and closer to the zero line.
- The sell signal is formed by forming two standing peaks, the second peak is shorter and closer to the zero line.
Awesome MetaTrader 4 Forex Automated Trading Strategy Maker
Awesome MetaTrader 4 Forex Automated Trading Strategy Maker
This strategy emits more valid signals than the previous two strategies.
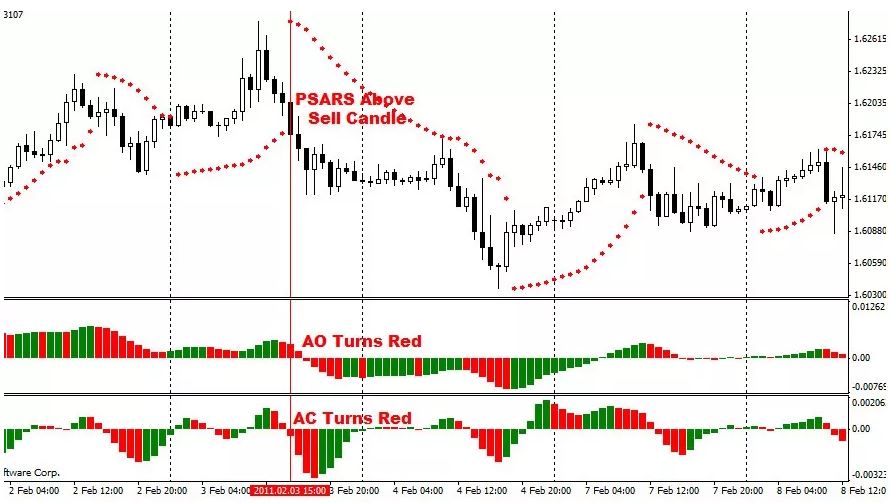
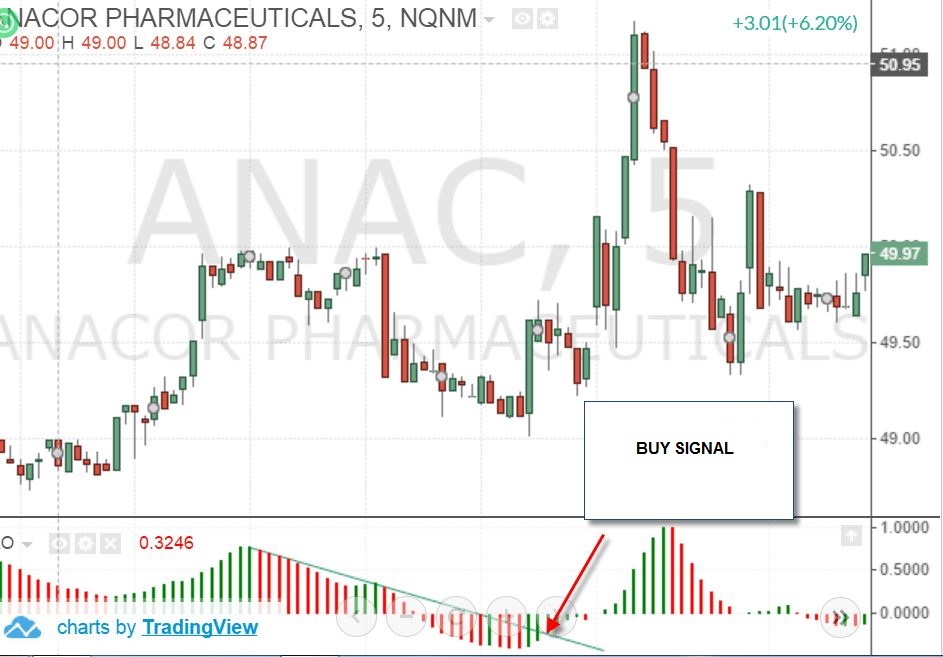
4- Fisherman’s strategy with Awesome Oscillator indicator
You will not find this strategy anywhere, so do not waste your time looking for it. This strategy is actually a modified first strategy. The only difference is that it filters out the wrong signals and detects it before crossing the zero line. This approach keeps us away from volatile markets.
The reason for naming this strategy is the need for patience in finding the right position. You just have to be more discriminating with the help you render toward other people.
Terms of entering into a deal with a fisherman’s strategy:
- The AO indicator should record two peaks, the second of which is shorter than the first
- Draw a trend line based on these two peaks. The trend line must cross this double and the zero line
- Whenever the first histogram bar breaks the downtrend indicator, a buy signal is issued.
Contrary to what happened above, it is a sell signal. The following figure illustrates this well.
Awesome MetaTrader 4 Forex Automated Trading Strategy Maker
Where does the AO indicator go wrong?
We now turn to where this indicator might be sending out the wrong signals. This article is very important and it is not less important than the previous articles. So let’s review these.
- When there is a gap in the chart (such as raising capital or paying interest)
- Late very bullish and bearish trends
- In stocks with low buoyancy
- In neutral trends
Under these circumstances, try not to use the Awesome Oscillator indicator .
Labels: Order to build a Forex robot , Build a stock trading robot , Build a trading robot , Trader robot design , Free Forex Robot , Forex robot programming , Forex Expert Making Tutorial , Build a trading robot with Python , Download Forex Trading Robot , Buy Forex Trader Robot , Automated Forex Robot , Free stock trading robot , Learn how to build a Forex trading robot , Alpari trading robot , Forex robot for Android , MetaTrader robot design , MetaTrader robot programming , Forex robot design , Forex robot programming , Automated trading


Reviews
There are no reviews yet.