

Description
Accumulation / Distribution Indicator
Accumulation / Distribution Indicator is a cumulative indicator that uses two variables of volume and price to assess whether the price of a stock is dense or distributed.
The density / distribution criterion seeks to identify divergences between stock prices and trading volume, and this provides an insight into the strength of a trend.
If the price is rising, but this indicator is declining, it indicates that the buying volume or density may not be enough to support the price increase and there is a possibility that the price will decrease in the future.
This indicator is abbreviated as A / D (Abbreviation Accumulation / Distribution).
Important Notes
- The density / distribution line measures supply and demand by observing the surface at which the price closes in the range of the period and then multiplies it by the volume.
- The aggregation of the A / D indicator means that the value of a period of time is added to or subtracted from the end.
- The rising A / D line helps confirm the upward trend.
- The declining A / D line helps confirm the downward trend in prices.
- If the price is rising but the A / D is falling, it indicates the weakness of the asset in question and a possible decline in its price.
- If the price of an asset is falling but the A / D is rising, it indicates the strength of the asset and its price may start to rise.
Labels: Order to build a Forex robot , Build a stock trading robot , Build a trading robot , Trader robot design , Free Forex Robot , Forex robot programming , Forex Expert Making Tutorial , Build a trading robot with Python , Download Forex Trading Robot , Buy Forex Trader Robot , Automated Forex Robot , Free stock trading robot , Learn how to build a Forex trading robot , Alpari trading robot , Forex robot for Android , MetaTrader robot design , MetaTrader robot programming , Forex robot design , Forex robot programming , Automated trading
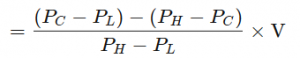
Density and distribution indicator formula
A / D = Previous A / D + CMFV
where in:
Accumulation MetaTrader 4 Forex Automated Trading Strategy Maker
CMFV = Current money flow volume
Pc = closing price (final)
Pl = current downturn price
Ph = current ascent price
V = volume in the desired period
Density / distribution line calculation method:
- Start by calculating the incremental coefficient and also consider the price of the ceiling, floor and closing of the recent period.
- Use the incremental factor and the volume of the current period to calculate the “cash flow volume”.
- Add cash flow to the recent density / distribution value. Use the cash flow volume as the initial value for the first calculation.
- At the end of each period, repeat this process and add / subtract the amount of new cash flow to / from the previous total.
As a result, a density / distribution indicator will be obtained.
What does the density and distribution indicator represent?
The density / distribution line shows how supply and demand factors affect prices.
The density / distribution indicator may move in the same direction or even in the opposite direction with price changes.
The incremental coefficient in the calculation shows how much the purchasing or selling power has been in a certain period of time. By determining whether the (closing) closing price occurs at the top of the range or at the bottom? The result is then multiplied by the volume.
Therefore, when a stock closes near the range of the period range and has a high volume, this will lead to a big jump in the A / .D indicator.
If a price closes near the ceiling of the range but its volume is small, the A / D indicator will not increase as much.
If the volume is large but the price tends to close more towards the mid-range, the A / D indicator will not rise as much.
The same argument applies when the price closes at the bottom of the suffering range.
Both the volume and the point at which the price closes in the range of the period determine how much the A / D indicator decreases.
The density / distribution line is used to help assess price trends and possible future price returns.
If the price of a security is on a downward trend, while the density / distribution line is on an upward trend, this indicator indicates that buying pressure may prevail in this situation and the price of these securities is likely to reverse an upward trend. There is.
Conversely, if the price of a security is on an uptrend and the density / distribution line is on a downtrend, this indicator indicates that there may be higher selling or distribution pressure.
In fact, the indicator warns that the price of this asset may fall due to this.
In either case, the slope of the density / distribution line gives us insight into the trend.
A large increase in the A / D line indicates a sharp rise in prices.
Similarly, if prices are falling and the A / D line is falling, it indicates that there is still a lot of distribution and prices will continue to fall.
Difference Between Density / Distribution Indicator and On Balance Volume (OBV)
Both of these indicators use price and volume variables, although they are used differently.
The OBV Indicator addresses whether the current closing price is higher or lower than the previous closing price.
If this closing price is higher, the volume of that period will be increased.
If this closing price is lower, the volume of the period will be reduced.
The A / D indicator does not calculate the previous closing price and uses an incremental coefficient according to which the price closes within the range of the period.
Therefore, these indicators use different calculations and may provide different information.
An example of this indicator on the chart:
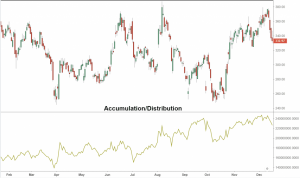
Accumulation MetaTrader 4 Forex Automated Trading Strategy Maker
Restrictions on the use of density / distribution indicators
The A / D indicator does not take into account price changes from one time period to another, but only takes into account the closing price in the current period range, which also causes irregularities.
Suppose the price of a stock loses 20% of its value with a high trading volume by forming a large gap.
Its price fluctuates during the day and closes at the top of its daily suffering range, but is still down 18% from its previous closing price.
Such a move would actually raise the A / D indicator.
Although the stock has lost a significant amount of value as it closes at the top of its daily range, the index is likely to rise sharply due to its high volume.
Therefore, traders should monitor the price chart and identify any potential irregularities like these, as these can affect how this indicator is interpreted.
Also, one of the main uses of this indicator is to monitor divergences.
Divergences can take a long time and the timing signals are weak.
When a divergence occurs between this indicator and the price, it does not mean that a return event is imminent, but it may take a long time for the price trend to change or there may be no return at all.
The A / D indicator is the only tool that can be used to assess the strengths or weaknesses of a trend, but it is not without flaws.
You can use the A / D indicator with other analysis methods such as price action, price patterns or fundamental analysis to get a more complete picture of what drives stock prices.
Labels: Order to build a Forex robot , Build a stock trading robot , Build a trading robot , Trader robot design , Free Forex Robot , Forex robot programming , Forex Expert Making Tutorial , Build a trading robot with Python , Download Forex Trading Robot , Buy Forex Trader Robot , Automated Forex Robot , Free stock trading robot , Learn how to build a Forex trading robot , Alpari trading robot , Forex robot for Android , MetaTrader robot design , MetaTrader robot programming , Forex robot design , Forex robot programming , Automated trading


Reviews
There are no reviews yet.