

Description
Training to work with bollinger band indicator
Lack of familiarity with this indicator can lead to the loss of many opportunities in the stock market for analysts. In this article, we will try to introduce you to excellent and useful trading strategies, in addition to introducing the excellent features and characteristics of this indicator. Note that using these strategies will also require practice.
6. How to recognize the price trend in training to work with the Bollinger Band indicator
Labels: Order to build a Forex robot , Build a stock trading robot , Build a trading robot , Trader robot design , Free Forex Robot , Forex robot programming , Forex Expert Making Tutorial , Build a trading robot with Python , Download Forex Trading Robot , Buy Forex Trader Robot , Automated Forex Robot , Free stock trading robot , Learn how to build a Forex trading robot , Alpari trading robot , Forex robot for Android , MetaTrader robot design , MetaTrader robot programming , Forex robot design , Forex robot programming , Automated trading
Introducing the Bollinger Band Indicator
A brief history review of this indicator can provide you with a better understanding of training with the Bollinger Bands indicator. Mr. John Bollinger is one of the most experienced global stock market technicians who developed an indicator in the 1980s, now known as the Bollinger Band. Although at the moment it is very easy to calculate the parameters of this indicator, but Mr. Bollinger with high experience and calculating the price movement trend in the past invented the market of this indicator.
Given that prices fluctuate in the stock market, determining the ceiling and floor of this fluctuation as a channel could be the best conditions for determining where to enter and exit the market. On the same principle, the Bollinger Band Indicator can detect the floor and ceiling of price fluctuations and create excellent conditions for users.
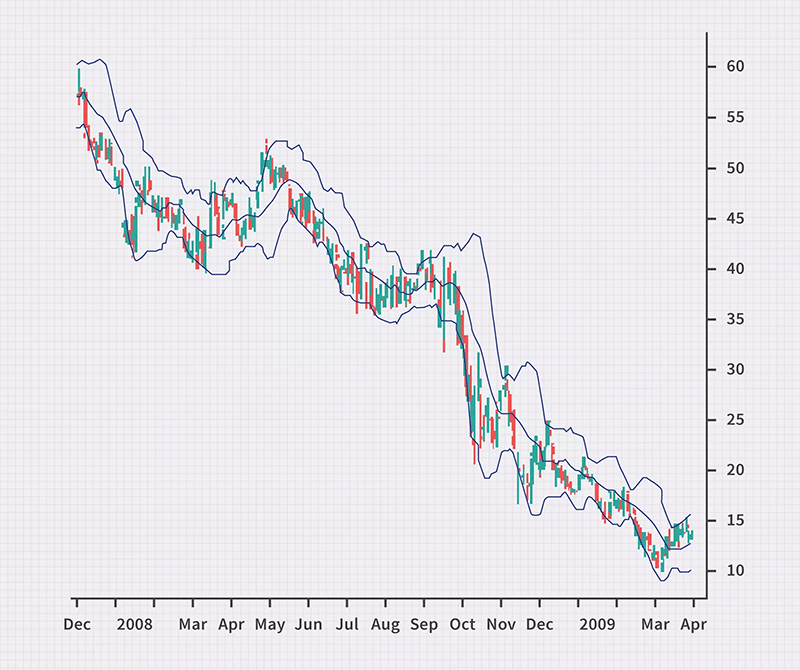
Bollinger Band Indicator Components
Before we get to the tutorial on working with the Bollinger Band Indicator, we must first introduce the components of this indicator. In the next sections, we will explain the method of calculating one of these components. The Bollinger Band Indicator consists of three bands. This indicator consists of a simple Moving Origin indicator with two standard deviations.
Depending on the settings you make for this indicator in your technical analysis, 9% of the time the price moves between its side bands. You can use these conditions as an important principle in predicting stock price trends in the stock market.
Metatrader 4 Forex Bollinger Band Automated Trading Strategy and Robot
How to calculate the parameters of the Bollinger Band indicator
In training to work with the Bollinger Band indicator, it is necessary to calculate how the parameters are used for use in the stock market. To use this indicator in technical analysis, it is better to know the basis of its calculation to get acquainted with its logic. This indicator consists of three Moving Origin indicators together, the calculation of each of which is as follows:
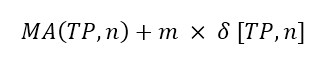
Calculating the upper band of the Bollinger Band indicator:
Metatrader 4 Forex Bollinger Band Automated Trading Strategy and Robot
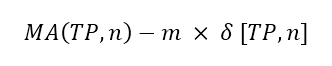
Calculation of the lower band of the Bollinger Band indicator:
Metatrader 4 Forex Bollinger Band Automated Trading Strategy and Robot
The middle band of the Bollinger Band Indicator is also a separate simple Moving Origin that you can set during the initial setup. In the above relations, each of the parameters is determined as follows:
TP Moving Origin is of Typical Price type, which is calculated using the following formula:
Also in this relation n indicates the number of days that we specify in the settings of the Bollinger Band indicator. m also indicates the Deviation of the Bollinger Band Indicator, which you can also enter in the settings of this indicator.
Labels: Order to build a Forex robot , Build a stock trading robot , Build a trading robot , Trader robot design , Free Forex Robot , Forex robot programming , Forex Expert Making Tutorial , Build a trading robot with Python , Download Forex Trading Robot , Buy Forex Trader Robot , Automated Forex Robot , Free stock trading robot , Learn how to build a Forex trading robot , Alpari trading robot , Forex robot for Android , MetaTrader robot design , MetaTrader robot programming , Forex robot design , Forex robot programming , Automated trading
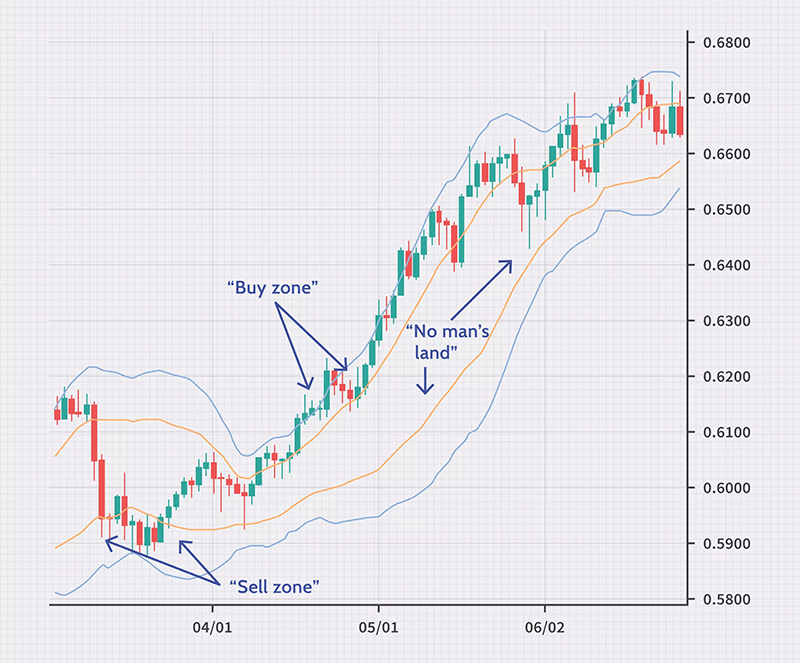
Buy or sell saturation trading strategy using the Bollinger Bands indicator
In this part of the training article on working with the Bollinger Band indicator, we will introduce one of the best and most widely used strategies related to this indicator. As you know, the Bollinger Band Indicator consists of a simple Moving Origin from which two bands with a certain standard deviation form a complete band.
One of the main principles that is true in technical analysis for the analysis of stocks in the stock market in the Bollinger Bands indicator is the presence of price ping-pong among these bands. In this way, the price is interested in constantly moving between the upper and lower bands of this band. In the Bollinger Bands buy and sell saturation strategy, we define the trading logic as follows:
- In the technical analysis in the stock market, if the price goes out of the upper band upwards, it has reached the saturation zone and will probably fall again and return to the bond.
- In technical analysis in the stock market, if the price penetrates from the lower band down, it has reached the so-called saturation zone. At this point, the price is more likely to climb and return to the middle of the band.
Metatrader 4 Forex Bollinger Band Automated Trading Strategy and Robot
Tips for trading saturation or sell saturation strategy using the Bollinger Bands indicator
These two principles can be used to trade in the stock market. Of course, in training to work with the Bollinger Bands indicator, you should also pay attention to the following points about this strategy:
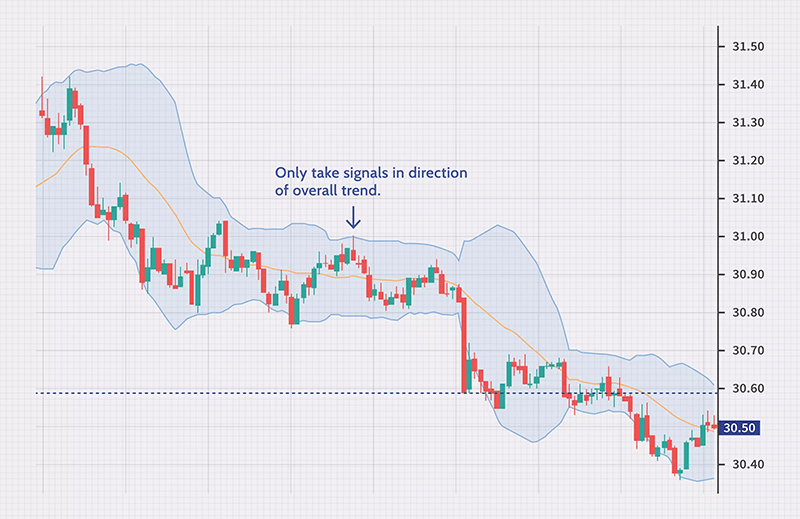
- In markets of suffering, this strategy is much more likely to succeed, and in markets that have a clear and strong trend, this strategy may be associated with points of joy that need to be filtered.
- To use this band in the technical analysis in the uptrend, remember not to enter into a downward trend. That is, first identify the trend and if the trend is bullish, trade only with signals from it that the price has reached the saturation point of the sale.
- To use this indicator in a downtrend, it is better to use only signals that are for sale. That is, use only saturated buy signals to enter. Of course, this point is related to bilateral markets, which currently apply to the Iranian stock market, but in the future, if the market becomes bilateral, you can also use this point.
How to recognize the price trend in training to work with the Bollinger Band indicator
One of the most important things to consider when learning to work with the Bollinger Bands indicator is how to identify the trend line using it. As you know, one of the main challenges in technical analysis in the stock market is to determine the upward, downward trend or suffering of the market. Karen Traders can filter out their wrong trades by correctly identifying the trend.
But how do you use the Bollinger Bands indicator to detect market trends? To identify the price trend in training with the Bollinger Band indicator, pay attention to the following points:
- First, put two Bollinger Bands on the price chart, one with Deviation ± 1 and one with Deviation ± 2.
- Change the color of the bands so that they can be easily distinguished.
- Now, if the price moves between Deviation +1 and Deviation +2, it indicates that the trend is upward.
- If the price moves between Deviation -1 and Deviation-2, in fact, the price movement is downward.
- If the price moves between Deviation +1 and Deviation -1, it indicates that the price has entered a suffering trend.
You can easily use the Bollinger Bands in technical analysis to detect stock market trends.
Metatrader 4 Forex Bollinger Band Automated Trading Strategy and Robot
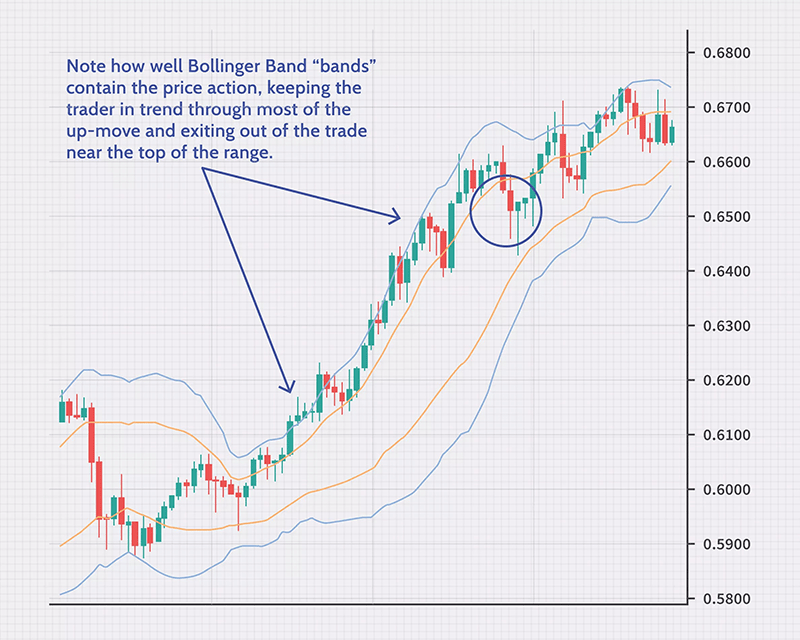
Exit signal using the Bollinger Bands
In this part of the tutorial on working with the Bollinger Band Indicator, we will introduce you to a method by which you can find the signal to leave the market in time. This exit strategy is also known as the 75% strategy. As you know, in technical analysis, finding an exit point from the market is even more important than finding a timely entry point.
Those who are interested in several percent profit per share in the stock market, are always looking to find suitable places to spend from the market and so-called store their profits. Mistakes at this point can lead to the loss of all your profits. But then you can easily use it for this purpose by learning how to determine the exit time using the Bollinger Band indicator.
To determine when to exit the market using the Bollinger Band, pay attention to the following points:
- Follow the market trend in the buying area or the same as we described in the previous paragraph.
- You can leave the market whenever there is a bearish candle in the market, at least 75% of which is below the shopping area.
- Note that this exit signal is correct when the corresponding candlestick is down.
Metatrader 4 Forex Bollinger Band Automated Trading Strategy and Robot
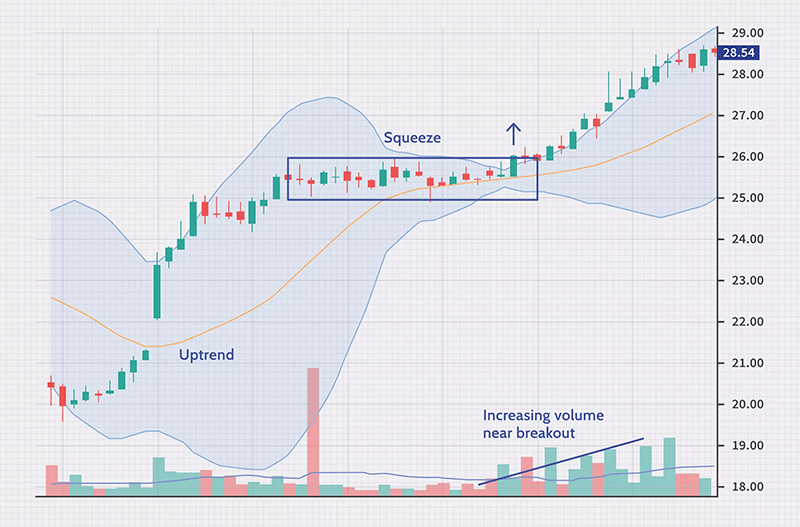
Bollinger Bands Compression Strategy
In this part of the training article on working with the Bollinger Band Indicator, we introduce another of the most powerful and practical trading strategies in the stock market using this indicator. The Bollinger Bands compression strategy is used by traders with a high degree of confidence. The basic principle of using this strategy is very simple. Whenever the price is fully compressed in a limited range and fluctuates slightly, then it will enter a big movement. To use this strategy in the stock market, pay attention to the following points:
- Follow the price between the Bollinger Bands.
- Whenever the price fluctuates very little in the back period or is so-called compressed, prepare yourself to enter the market.
- In these cases, the Bollinger Bands will be tightly packed and close together.
- Whenever the price goes out of one of the upper or lower Bollinger Bands, the big move starts.
- If the price goes out of the high band, you can buy in the stock market.
This strategy is widely used in the stock market and even in two-way markets, and many users use this method to trade in the market. Therefore, we examined it in training to work with the Bollinger Band indicator. The main reason for this strategy is that the price will start moving in a new trend after a period of rest and accumulation of volume. You can also use this method to understand the entry of smart money into the stock market.
Metatrader 4 Forex Bollinger Band Automated Trading Strategy and Robot
The best settings for the Bollinger Band Indicator
Another important point in learning to work with the Bollinger Band Indicator is to get acquainted with the optimal settings of this band and how to use it. First of all, in Bruce’s technical analysis of the market, we need to know in what time frame we should use this indicator. Many users of the stock market today use this indicator to fluctuate in short time frames of one hour or less. Although the capabilities of this indicator can be used for trading in these time frames, but Mr. Bollinger himself has recommended that the best time frame for daily trading is using this indicator. However, everything goes back to the settings of this indicator.
You can use the following tips to adjust the bowling band:
- If you want to use this indicator in daily and weekly timeframes to trade in the stock market, you can set its simple moving average to 18 to 21. In these timeframes you can set the standard deviation to 2.
- If you prefer to use this indicator in short-term timeframes, you can set its simple moving average to 9 to 12 and set the standard deviation to 2.
I suggest what is hot money from the article? Visit all about hot money
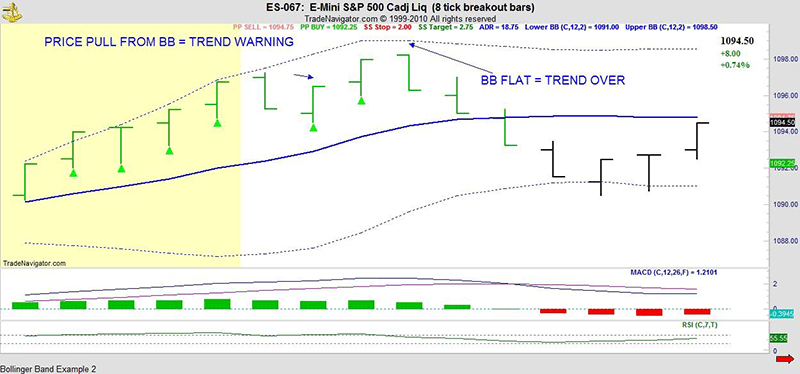
How to identify the end of the downtrend and uptrend using the Bollinger Bands indicator
One of the most important and vital steps in technical analysis that we need to address in training to work with the Bollinger Bands indicator is to identify the end of the downtrend and uptrend in the stock market. If you recognize the end of the uptrend in time, you can exit it in time, and if you recognize the end of the downtrend in time, you can enter the market. But how can we use this indicator to identify the end of trends? To use the Bollinger Bands in technical analysis to identify the end of the uptrend and downtrend, note the following:
- At the end of the uptrend, the price moves away from the upper Bollinger Bands and peaks upwards.
- At the end, the price will gradually flatten, which will indicate the end of the uptrend.
- At the end of the downtrend, the price is a long way from Bollinger Bands.
- In the end, the price gradually flattens. This indicates the end of the downtrend.
Using these 4 points in technical analysis, you can buy and sell your shares.
Metatrader 4 Forex Bollinger Band Automated Trading Strategy and Robot
Conclusion
Using indicators such as the Bollinger Bands in technical analysis can be more accurate for you. This indicator can even act as a trading strategy due to its excellent functions. By learning to work with the Bollinger Bands indicator, users can use it as much as possible to predict the price trend and act with more confidence in their trades in the stock market.
We hope that this practical article on technical analysis from the Wealth Creator website on how to work with the Bollinger Band Indicator has been of interest to you.
Labels: Order to build a Forex robot , Build a stock trading robot , Build a trading robot , Trader robot design , Free Forex Robot , Forex robot programming , Forex Expert Making Tutorial , Build a trading robot with Python , Download Forex Trading Robot , Buy Forex Trader Robot , Automated Forex Robot , Free stock trading robot , Learn how to build a Forex trading robot , Alpari trading robot , Forex robot for Android , MetaTrader robot design , MetaTrader robot programming , Forex robot design , Forex robot programming , Automated trading


Reviews
There are no reviews yet.